To be successful in investing it is important to make diversified investments aligned with the investment time horizon and the investor risk profile
What is at stake in assessing our investor risk profile?
The historical returns and risks of model portfolios associated with different investor profiles
To be successful in investing it is important to make diversified investments aligned with the investment time horizon and the investor risk profile
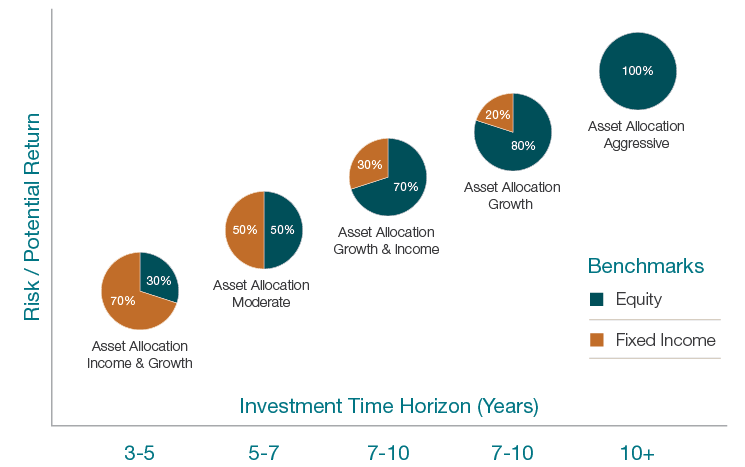
In a previous post we realized that to be successful in our investments, the asset allocation must be the result of an attractive combination of the investment time horizon (number of years to achieve the objective target capital and number of years to use that capital) and the investor risk profile.
The time horizon and risk profile – risk capacity and risk tolerance – change the central allocation to fewer or more stocks (i.e. less or more risk and less or more expected returns).
We will be much more conservative the less time horizon we have and the more risk intolerant we are, and we would be bolder, the longer the time horizon we have and more risk tolerant we are.
The importance of being certain of our investor profile: maintaining the course and the of long-term investments perspective in the face of short-term market fluctuations
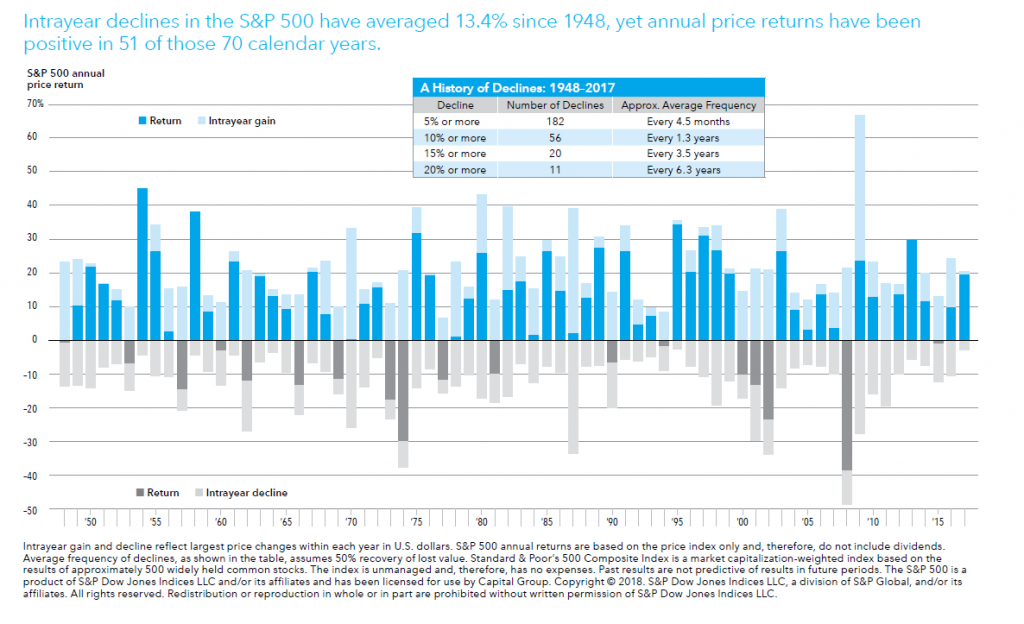
The following chart shows that despite the positive returns of S&P 500 in 51 of the last 70 years, in each year there were average intra-year declines of 13.4% that could have made many investors give up on these investments, due to excessive worry or anxiety.
If this were to happen, the very interesting average annual return wouldn’t be achieved.
Or, to get a better notion of the figures:
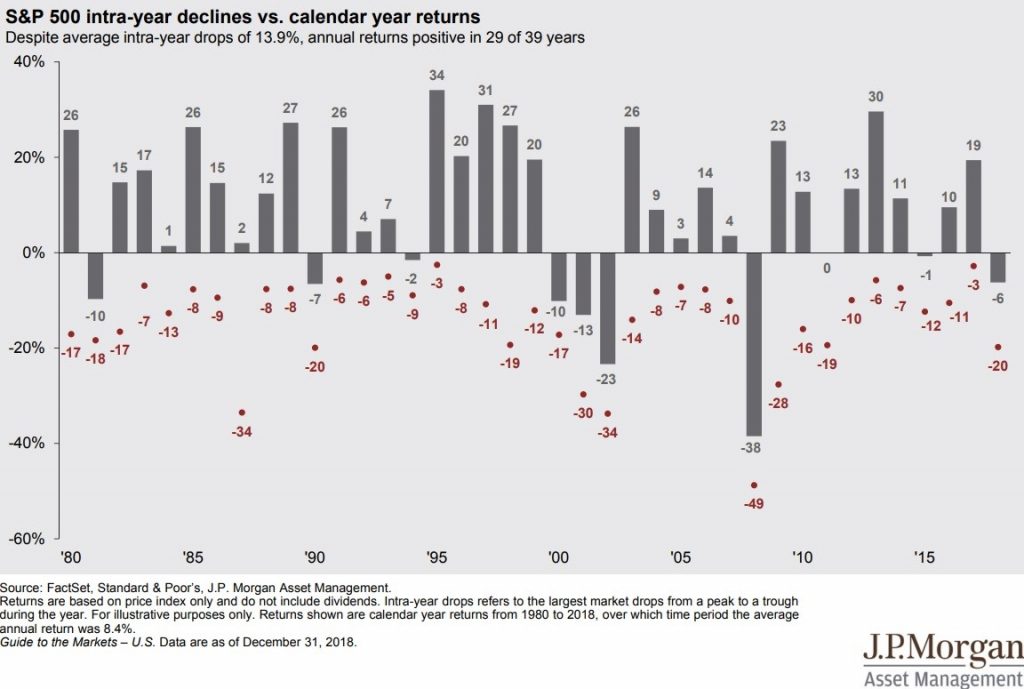
Hence the importance of the investor profile. It is the reason or the anchor that makes us stay our course when we face adverse fluctuations in the short-term market and maintain the perspective of investment in the medium and long term.
What is at stake in assessing our investor risk profile?
To better understand what is at stake it is necessary to have in mind three key issues:
- More profitable allocations correspond to more risk;
- Making investments is a medium-and long-term process, and as such, we will be subject to situations or scenarios of investments declines and losses, notably in the stock markets, as we have seen in the chart above;
- To take advantage of our investments, we must be able to stay on course and keep up to the discipline of our decisions, avoiding the market noise of its fluctuations in the short term.
The historical returns and risks of model portfolios associated with different investor profiles
There are essentially 3 ways to find out what is our investor profile:
- Alignment or personal consonance to the medium and long-term historical returns and risks associated with model portfolios with investment allocations associated with different investor profiles;
- Evaluation by response to investor risk profile questionnaires;
- Trial and error actions, i.e., we define an initial profile with which we identify with and adjust it according to our behaviors and reactions to the evolutions of our investments and markets.
In this post we will only deal with the first case.
The investor risk profile questionnaire will be addressed in a following post. The third way is an ex-post situation, of a practical nature, which can and must combine with either or both above.
To do so, it is necessary to know the model portfolios allocation historical risks and returns, in more detail.
The following graph shows the return and risks of model portfolios corresponding to different allocation profiles used by one of the leading companies in the world in terms of asset management and investment funds:
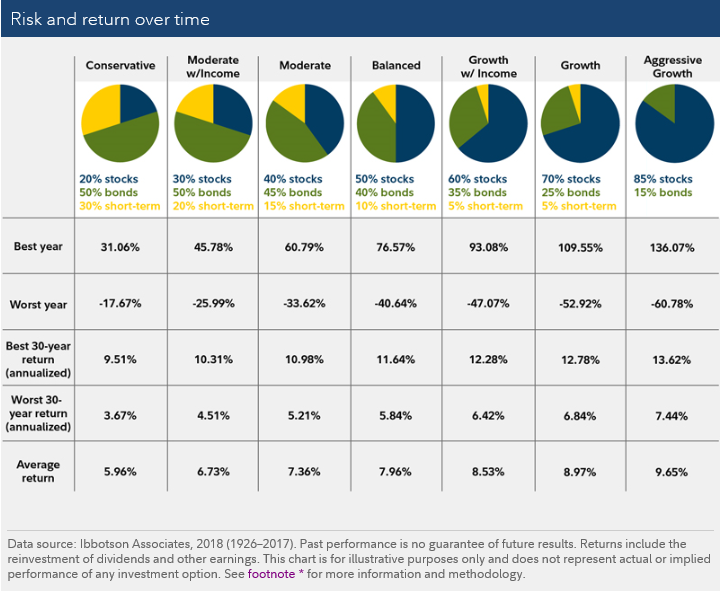
Source: How to start investing, Fidelity, 04/04/2018
Fidelity has 7 model portfolios allocations: Conservative, Moderate, Moderate with Income, Balanced; Growth with Income, Growth and Aggressive growth.
Note that these portfolios could easily be 5 instead of 7 model portfolios if we exclude the income options, whose sole purpose is to tap regular income distributions associated with periodic interest given by a greater allocation to bonds.
These portfolios contain allocations to three US assets: stocks (S&P 500), bonds (10-year Treasury bonds) and short-term (3-month Treasury bills).
The figures relate to data observed during the period from 1926 to 2017, and show yearly returns (best, worst and average) as well as 30-year period returns (best and worst).
Allocations range from 20% in stocks in the conservative portfolio to 85% in stocks in the most aggressive portfolio.
The conclusions are as follows:
- Average annual portfolio returns varied from 5.96% in the conservative and 9.65% in the more aggressive;
- Annual portfolios returns ranged from the maximum and minimum values presented. For example, in the Balanced portfolio, the highest annual profitability was + 76.57% and the worst was -40.64%;
- Maximum and minimum values of annual average returns of the portfolios for 30-year investment periods are also presented. Once again, using the Balanced portfolio as an example, the highest average annual return of a 30 years holding period was + 11.64% and the worst was + 5.84%.
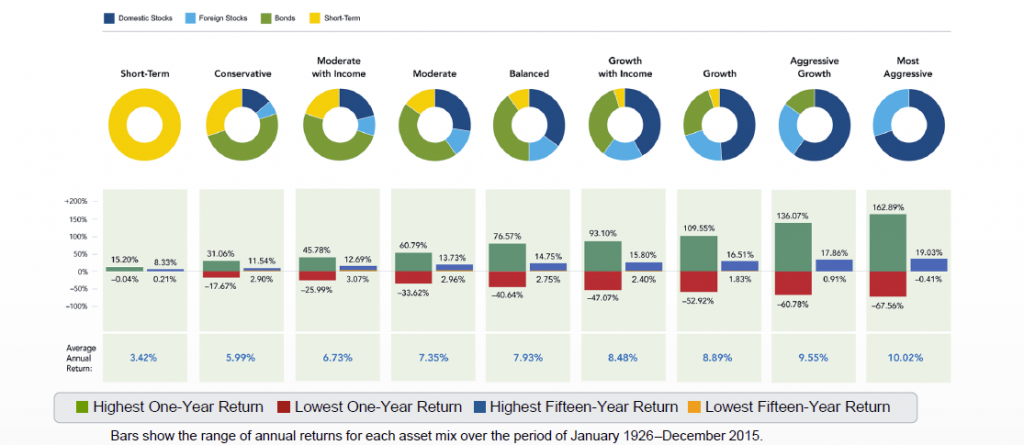
Fidelity had also previously presented earlier similar model portfolios with the following compositions and results:
Source: Fidelity
There are a lot of similarities with previous case, with a few differences that are important to better assess what is at stake:
- First, the values refer to the period from 1926 to 2015. Second. There is a split of investment in stocks by geographies: Domestic (S&P 500) and Foreign (MSCI World Ex-US);
- There are two additional model portfolios in the extremes: one Short-Term or ultraconservative, and a Most Aggressive formed exclusively by investments in stocks. It should be noted that the portfolio only with Short-Term investments has an average annual return of + 3.42% compared with the + 5.99% of the Conservative portfolio;
- The average annual return intervals were evaluated for a period of 15 years instead of the previous 30 years. For the Balanced portfolio, as an example, in the 15-years investment period the maximum annual return goes to + 14.75% and the minimum to + 2.75% (this range of returns is obviously higher than that of the higher 30-years investment period).
Lastly, we present another similar chart from Fidelity but showing intervals of return for a shorter investment period, only 5 years:
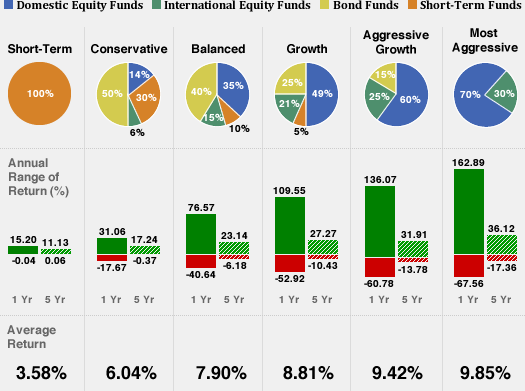
Taking the Balanced portfolio as an example, the range of annual average returns for 5-years investment periods stood between the maximum of +23.14% and a minimum of -6.18% (again and as expected, the range of returns increases with the narrowing of the investment period from 15 to 5 years).
Carefully viewing each of these charts is a very useful way to define our investor profile as a whole or for a specific financial objective/goal.


