


The importance of knowing the market PER fair value and predicting its EPS
The value of the market PER (and CAPE) over time
S&P 500 PE valuation multiple and 10-year treasury bond interest rates
The evolution of the S&P 500 EPS
Multiply the PER by the EPS to get the market value
The markets valuation is a frequent discussion, of today and many other days.
Since the beginning of the year, stock markets have recorded strong falls, with corrections of more than 20% in the 3 major U.S. indices, which put the market in a bear market situation:

This has put many investors worried and alert about their investments.
Aggravating this theme, bond investments also suffered sharp losses.
Thus, it is natural for many investors to question the current context of the markets and their valuation.
The theme is complex.
We have to consider the averages of the stock market multiples, and the sensitivity of the valuation to interest rates, both for multiples and for the companies earnings.
Stocks and bonds have risen sharply in recent years, which many forget, including more than 20% a year in the 3 years between 2019 and 2021, with a pandemic in the middle (as well as the bull market since the end of the Great Financial Crisis in 2009).
And in early 2022, they were trading at very high multiples due to strong economic policy stimulus that brought interest rates to zero.
The change in the context of the cycle – rising inflation, interest rates and reversal of stimulus – causes readjustment of asset prices.
So now we are in a process of adjusting to a whole new reality.
Inflation at highs of the last 40 years, end of quantitative easing of the last 20 years, rising interest rates and quantitative tightening.
Moreover, an invasion and war in Europe as it did not happen more than 70 years ago, triggered by a military superpower and with very influential economic power, particularly in energy matters.
The big question of the moment is when the ongoing adjustment process ends, or what the new market assessment is.
It is especially in these times of tension, volatility and market transformation that questions about market valuation are intensified.
In another article, we looked at the various most significant market corrections.
These corrections are difficult to anticipate and much less frequent than market corrections between 10% and 20%,which we have also addressed.
In a more recent article, we have already seen the effects of rising interest rates in an inflationary context.
In other more recent articles, we have looked at the importance of monetary policy for asset yields, and to prepare for its changes, such as the one in progress.
The importance of knowing the market fair value of the PER and predicting its EPS
One of the most frequently asked questions for managers and investors is whether the market is overvalued or undervalued.
The answer to this question raises many themes and has many answers.
But it is inevitable that it will often fall into the value of the market’s PER multiple and corporate earnings estimates (“Earnings per Share” or EPS).
It is the easiest calculation to do because the index value is no more than multiplying these two factors.
And also because all market players have an opinion about each of them.
In other words, we want to know how much we should be willing to pay for the earnings of the companies in the market and what they will be.
It is the most common, simple and straightforward answer.
Hence the importance of the market PER and EPS, especially in times of great volatility and uncertainty.
From this point of view, the doubt unfolds on two major questions: what are the PER and EPS of the market at the moment?
The value of the market PER (and CAPE) over time
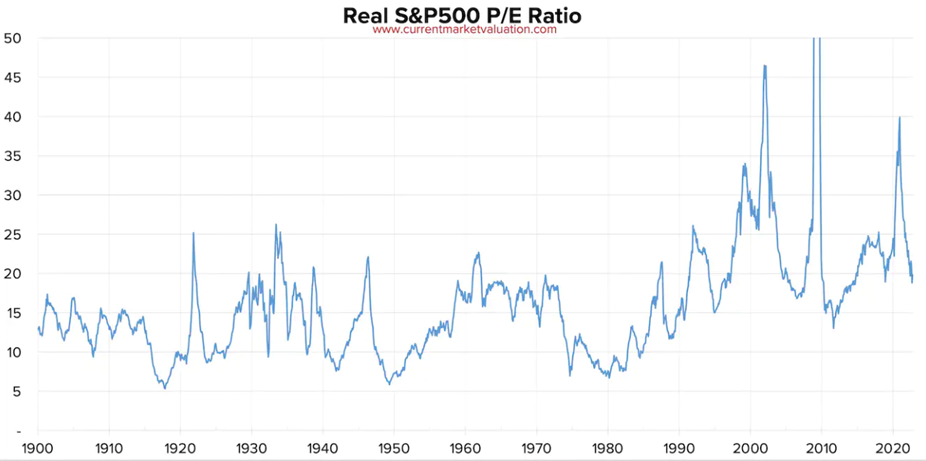
The following chart shows the PER of the S&P 500 from 1900 to date:
The following graph shows the evolution of the S&P 500 PER in recent years considering the results estimates for next year (forward PER):
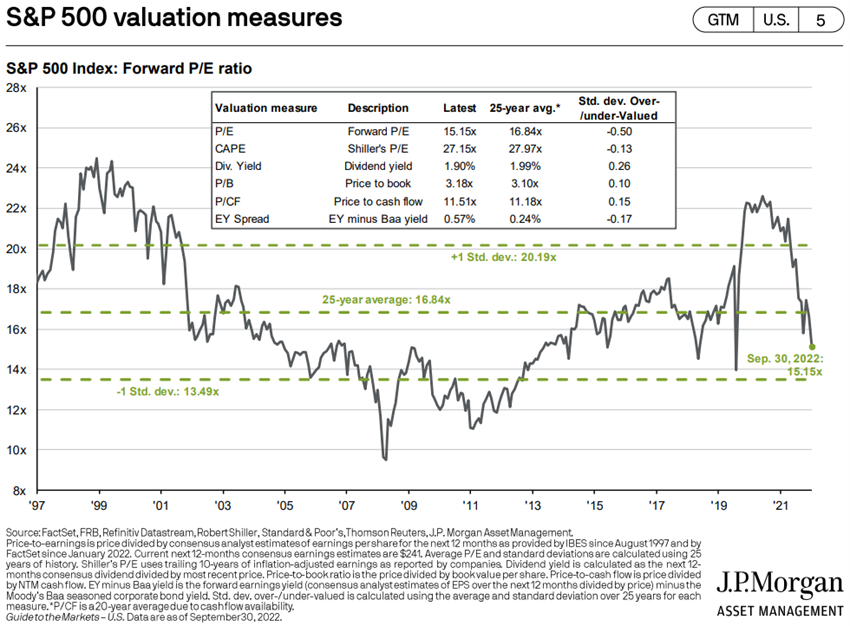
Currently, the S&P 500 PER is about 16x, above its long historical average, but virtually on average since 1980 and the last 10 years.
The value of PER has increased considerably since 1980 due to two factors.
On the one hand, the growing importance of technology companies in the index.
On the other hand, the fall in interest rates associated with the new monetary policy.
The PER value in each year is very sensitive to variations in results per share or EPS.
This is why the PER adjusted to the economic cycle, known as Shiller’s PER (CAPE), is increasingly used, which is based on the average of the results of the last 10 years.
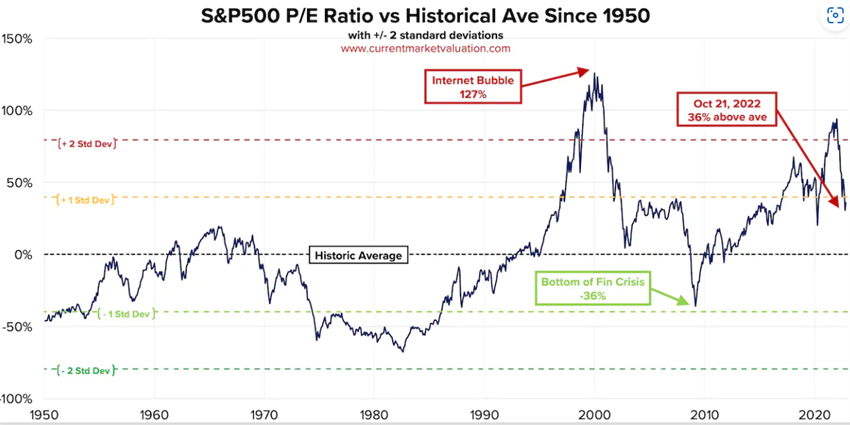
The following chart shows Shiller’s PER of the S&P 500 since 1900:
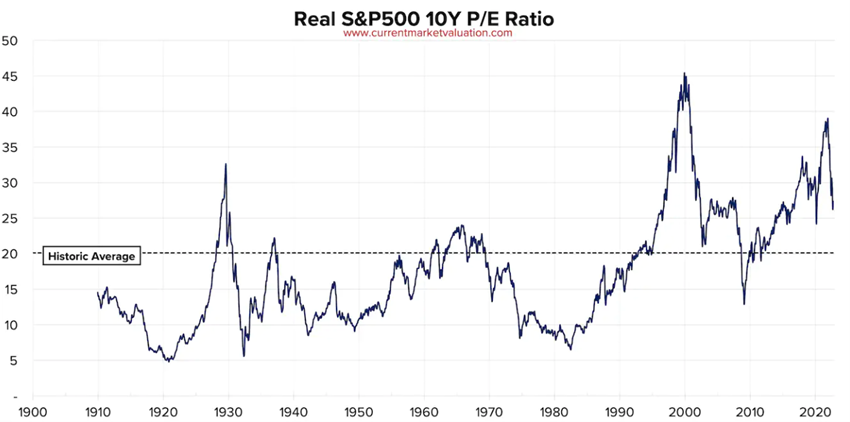
This CAPE, in real terms, is currently at about 28x, also well above the long historical average.
The PER is a static measure, even that of Shiller, which only takes into account the past.
Thus, there are those who use the multiple of PEG instead of per, which considers the expected growth of results in the future, increasing the degree of complexity.
In the following link we have an excellent summary of two different opinions on the multiples PER and CAPE of two respected economists and market valuation experts, Jeremy Siegel and Robert Shiller:
The evolution of the S&P 500 EPS
The S&P 500 EPS has had the following evolution in recent years:
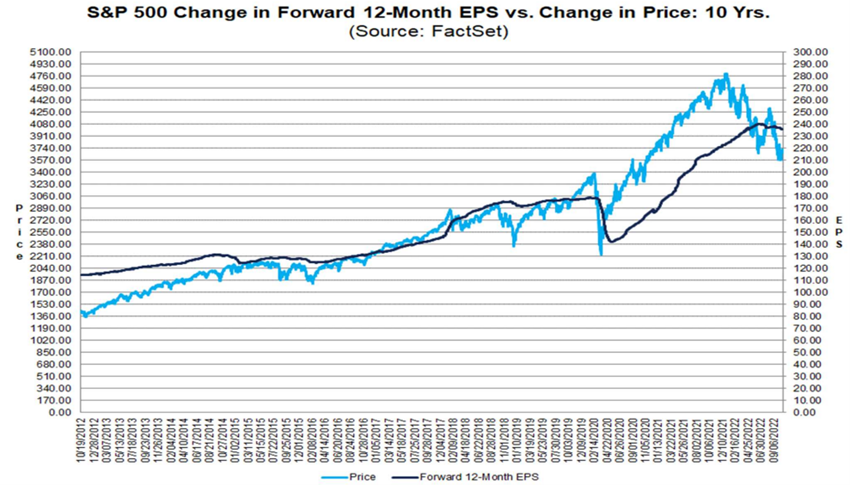
The current analyst consensus estimate for 2022 is $223 and $240 for 2023.
In the most normal recent period, between 2011 and 2019 – after the Great Financial Crisis and before the pandemic, the average growth rate of EPS was about 7% per year.
In 2018 and 2019, EPS remained at about $163, fell to $140 in 2020 (-15%), rose to $208 in 2020 (+49%), as a result of stimulus, and in the first half of this year it added $112 (+7%).
Multiply the PER by EPS to get the market value
Market valuation by the PER multiple results directly from the multiplication of PER by EPS.
Market valuations are made prospectively, and the term of 1 year is normal.
This means that they consider the PER (forward) and EPS planned for 2023.
With this information. we can do several simulations for the S&P 500 values.
In the current context where we do not prospect an expansion of the multiples, but rather a contraction, we use a range of variation for the PER between the minimum of the last decade 14x and the current value of 17x.
As for EPS, we use the values between the $180 that are admitted in a recession scenario for 2023 and the analysts’ estimate of $240, not yet revised down.
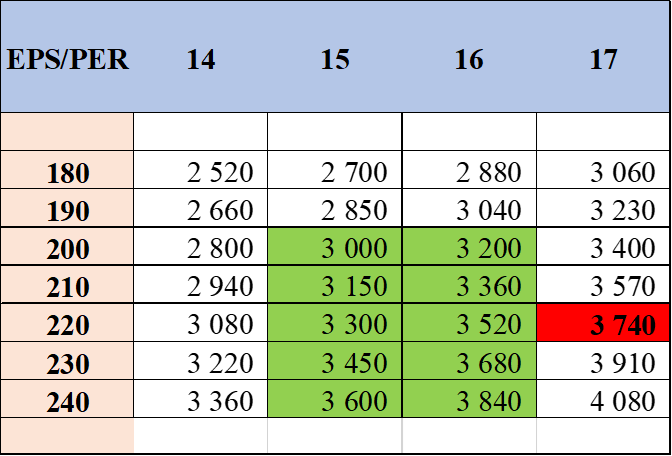
The red is evidenced by the current value of the market.
The green-marked scenarios are the most likely for the next 3 to 6 months, which put the S&P 500 between 3,000 and 3,840 points.
These scenarios presuppose the continuation of the War of Ukraine, and if there is, a mild recession in the USA, with unemployment rates below 5%.
A negotiated and rapid outcome would result in a significant increase in the per multiple.
A deep recession, with unemployment rising above 5%, would result in a multiple of PER and lower EPS levels.
This exercise was first published in the most recent quarterly article on market performance and outlook.


