• About us
    • Who we are
    • Mission
  • Contacts
  • English
    • Português (Portuguese (Portugal))
    • Español (Spanish)
    • Français (French)
  • Login
  • Register
Investorpolis
Advertisement
  • Home
  • Investing Series Guide
    • All
    • I. Goal Based Investing
    • II. Compounding & Inflation
    • III. Assets Risks & Returns
    • IV. Efficient Diversification
    • IX. Sustainable Investing and ESG
    • V. The Investor
    • VI. Assets and Investments
    • VII. Index Funds
    • VIII. Successful Investing
    • XI. Other Topics
    Simple Portfolio Series (DIY) Part 2: The Traditional Portfolio 60/40, what it is, for whom, and its performance

    Simple Portfolio Series (DIY) Part 2: The Traditional Portfolio 60/40, what it is, for whom, and its performance

    Simple or Lazy Portfolio Series (DIY): Part 1 – Overview

    Simple or Lazy Portfolio Series (DIY): Part 1 – Overview

    Choosing Mutual Funds Series: Part 5 – Funds availability and currency of investment

    Choosing Mutual Funds Series: Part 5 – Funds availability and currency of investment

    Maximize time invested in the stock market instead of market timing: Part 2. Impossibilities and losses (cont.)

    Maximize time invested in the stock market instead of market timing: Part 2. Impossibilities and losses (cont.)

    Maximizing time invested in the stock market instead of market timing: Part 1 – Biases and losses

    Maximizing time invested in the stock market instead of market timing: Part 1 – Biases and losses

    ESG Investing Series: Part 9 – Developments and models of corporate governance regulation in the world

    ESG Investing Series: Part 9 – Developments and models of corporate governance regulation in the world

    Trending Tags

      • I. Goal Based Investing
      • II. Compounding & Inflation
      • III. Assets Risks & Returns
      • IV. Efficient Diversification
      • V. The Investor
      • VI. Assets and Investments
      • VIII. Successful Investing
      • IX. Sustainable Investing and ESG
      • X. Kits and Tips
      • XI. Other Topics
    • Wealth and Investing
      • All
      • Investing
      • Wealth
      How Women invest: Part 2 – The results are equivalent to those of men, but with significant differences in investment management

      How Women invest: Part 2 – The results are equivalent to those of men, but with significant differences in investment management

      Outlook 2023: Part 5 – 2023 will be a transitional year with two halves

      Outlook 2023: Part 5 – 2023 will be a transitional year with two halves

      Outlook 2023: Part 4 – In changing economic cycle, policies, and market sentiment, valuation matters become more than ever

      Outlook 2023: Part 4 – In changing economic cycle, policies, and market sentiment, valuation matters become more than ever

      Outlook 2023: Part 3 – 2022 was bad for investments, but was not the same for everything

      Outlook 2023: Part 3 – 2022 was bad for investments, but was not the same for everything

      Outlook 2023: Part 2 – Investment losses in 2022 cost so much that sometimes we forget about previous gains

      Outlook 2023: Part 2 – Investment losses in 2022 cost so much that sometimes we forget about previous gains

      Outlook 2023: Part 1 – 2022 was a bad year for investments, but we can’t lose the medium and long-term perspective

      Outlook 2023: Part 1 – 2022 was a bad year for investments, but we can’t lose the medium and long-term perspective

      Trending Tags

        • Investing
        • Wealth
      • Retirement & Savings
        • All
        • Retirement
        • Savings
        Retirement Series: How much money do we need to live through retirement?

        Retirement Series: How much money do we need to live through retirement?

        Retirement Series: Part 1 – Overview – A backwards view

        Retirement Series: Part 1 – Overview – A backwards view

        How many years do our public or social pensions last?

        What is the replacement rate of retirement pensions?

        How many years will we live in retirement?

        Planning for a good financial life in retirement

        Trending Tags

          • Retirement
          • Savings
        • Tools
          • All
          • Calculators
          • Publications
          • Sites and apps
          Morningstar Rating for Funds

          Morningstar Rating for Funds

          Morningstar’s European Active/Passive Barometer

          Morningstar’s European Active/Passive Barometer

          Morningstar’s U.S. Active vs. Passive Barometer

          Morningstar’s U.S. Active vs. Passive Barometer

          The Power of Dividends: Past, Present, and Future, Hartford Funds, 2021

          The Power of Dividends: Past, Present, and Future, Hartford Funds, 2021

          OECD Corporate Governance Factbook 2021

          OECD Corporate Governance Factbook 2021

          G20/OECD Principles of Corporate Governance, 2015

          G20/OECD Principles of Corporate Governance, 2015

          Trending Tags

          • calculators
          • Calculators
          • Publications
          • Sites and apps
        • More
          • All
          • Best of
          Best Of Mutual Funds Series: Dividend Stocks for Investors Outside the U.S.

          Best Of Mutual Funds Series: Dividend Stocks for Investors Outside the U.S.

          Best Of Mutual Funds Series: Dividend Stocks for U.S. Investors

          Best Of Mutual Funds Series: Dividend Stocks for U.S. Investors

          Best Of Mutual Funds Series: Investment Grade Bonds, Indexed, for Eurozone Investors

          Best Of Mutual Funds Series: Investment Grade Bonds, Indexed, for Eurozone Investors

          Best Of Mutual Funds Series: US Bonds, Indexed, for US Investors

          Best Of Mutual Funds Series: US Bonds, Indexed, for US Investors

          Best Of Mutual Funds Series: Passive, US Large Stocks, for Non-US Investors

          Best Of Mutual Funds Series: Passive, US Large Stocks, for Non-US Investors

          Best Of Mutual Funds Series: Passive Large US Stocks for US Investors

          Best Of Mutual Funds Series: Passive Large US Stocks for US Investors

          Trending Tags

            • Best of
            • Reviews
            • Snapshots
            • Others
          No Result
          View All Result
          • Home
          • Investing Series Guide
            • All
            • I. Goal Based Investing
            • II. Compounding & Inflation
            • III. Assets Risks & Returns
            • IV. Efficient Diversification
            • IX. Sustainable Investing and ESG
            • V. The Investor
            • VI. Assets and Investments
            • VII. Index Funds
            • VIII. Successful Investing
            • XI. Other Topics
            Simple Portfolio Series (DIY) Part 2: The Traditional Portfolio 60/40, what it is, for whom, and its performance

            Simple Portfolio Series (DIY) Part 2: The Traditional Portfolio 60/40, what it is, for whom, and its performance

            Simple or Lazy Portfolio Series (DIY): Part 1 – Overview

            Simple or Lazy Portfolio Series (DIY): Part 1 – Overview

            Choosing Mutual Funds Series: Part 5 – Funds availability and currency of investment

            Choosing Mutual Funds Series: Part 5 – Funds availability and currency of investment

            Maximize time invested in the stock market instead of market timing: Part 2. Impossibilities and losses (cont.)

            Maximize time invested in the stock market instead of market timing: Part 2. Impossibilities and losses (cont.)

            Maximizing time invested in the stock market instead of market timing: Part 1 – Biases and losses

            Maximizing time invested in the stock market instead of market timing: Part 1 – Biases and losses

            ESG Investing Series: Part 9 – Developments and models of corporate governance regulation in the world

            ESG Investing Series: Part 9 – Developments and models of corporate governance regulation in the world

            Trending Tags

              • I. Goal Based Investing
              • II. Compounding & Inflation
              • III. Assets Risks & Returns
              • IV. Efficient Diversification
              • V. The Investor
              • VI. Assets and Investments
              • VIII. Successful Investing
              • IX. Sustainable Investing and ESG
              • X. Kits and Tips
              • XI. Other Topics
            • Wealth and Investing
              • All
              • Investing
              • Wealth
              How Women invest: Part 2 – The results are equivalent to those of men, but with significant differences in investment management

              How Women invest: Part 2 – The results are equivalent to those of men, but with significant differences in investment management

              Outlook 2023: Part 5 – 2023 will be a transitional year with two halves

              Outlook 2023: Part 5 – 2023 will be a transitional year with two halves

              Outlook 2023: Part 4 – In changing economic cycle, policies, and market sentiment, valuation matters become more than ever

              Outlook 2023: Part 4 – In changing economic cycle, policies, and market sentiment, valuation matters become more than ever

              Outlook 2023: Part 3 – 2022 was bad for investments, but was not the same for everything

              Outlook 2023: Part 3 – 2022 was bad for investments, but was not the same for everything

              Outlook 2023: Part 2 – Investment losses in 2022 cost so much that sometimes we forget about previous gains

              Outlook 2023: Part 2 – Investment losses in 2022 cost so much that sometimes we forget about previous gains

              Outlook 2023: Part 1 – 2022 was a bad year for investments, but we can’t lose the medium and long-term perspective

              Outlook 2023: Part 1 – 2022 was a bad year for investments, but we can’t lose the medium and long-term perspective

              Trending Tags

                • Investing
                • Wealth
              • Retirement & Savings
                • All
                • Retirement
                • Savings
                Retirement Series: How much money do we need to live through retirement?

                Retirement Series: How much money do we need to live through retirement?

                Retirement Series: Part 1 – Overview – A backwards view

                Retirement Series: Part 1 – Overview – A backwards view

                How many years do our public or social pensions last?

                What is the replacement rate of retirement pensions?

                How many years will we live in retirement?

                Planning for a good financial life in retirement

                Trending Tags

                  • Retirement
                  • Savings
                • Tools
                  • All
                  • Calculators
                  • Publications
                  • Sites and apps
                  Morningstar Rating for Funds

                  Morningstar Rating for Funds

                  Morningstar’s European Active/Passive Barometer

                  Morningstar’s European Active/Passive Barometer

                  Morningstar’s U.S. Active vs. Passive Barometer

                  Morningstar’s U.S. Active vs. Passive Barometer

                  The Power of Dividends: Past, Present, and Future, Hartford Funds, 2021

                  The Power of Dividends: Past, Present, and Future, Hartford Funds, 2021

                  OECD Corporate Governance Factbook 2021

                  OECD Corporate Governance Factbook 2021

                  G20/OECD Principles of Corporate Governance, 2015

                  G20/OECD Principles of Corporate Governance, 2015

                  Trending Tags

                  • calculators
                  • Calculators
                  • Publications
                  • Sites and apps
                • More
                  • All
                  • Best of
                  Best Of Mutual Funds Series: Dividend Stocks for Investors Outside the U.S.

                  Best Of Mutual Funds Series: Dividend Stocks for Investors Outside the U.S.

                  Best Of Mutual Funds Series: Dividend Stocks for U.S. Investors

                  Best Of Mutual Funds Series: Dividend Stocks for U.S. Investors

                  Best Of Mutual Funds Series: Investment Grade Bonds, Indexed, for Eurozone Investors

                  Best Of Mutual Funds Series: Investment Grade Bonds, Indexed, for Eurozone Investors

                  Best Of Mutual Funds Series: US Bonds, Indexed, for US Investors

                  Best Of Mutual Funds Series: US Bonds, Indexed, for US Investors

                  Best Of Mutual Funds Series: Passive, US Large Stocks, for Non-US Investors

                  Best Of Mutual Funds Series: Passive, US Large Stocks, for Non-US Investors

                  Best Of Mutual Funds Series: Passive Large US Stocks for US Investors

                  Best Of Mutual Funds Series: Passive Large US Stocks for US Investors

                  Trending Tags

                    • Best of
                    • Reviews
                    • Snapshots
                    • Others
                  No Result
                  View All Result
                  Investorpolis
                  No Result
                  View All Result
                  Home Investing Series Guide

                  We must live with the equity market corrections of between 10% and 20%

                  7 de March, 2021
                  in Investing Series Guide, VIII. Successful Investing
                  Reading Time: 12 mins read
                  0 0
                  0
                  Temos de viver com as correções do mercado acionista de entre 10% a 20%
                  Share on FacebookShare on Twitter

                  To succeed in investments, we have to live with the usual and frequent corrections of up to 10% and 20% of the equity markets OR Anatomy of an equity market correction

                  Equity markets show a very good historical performance, but not linear due to corrections

                  Market corrections of between 10% and 20% are frequent and often profound, and we need to know them to be prepared to go over them

                  We often live and feel crises through the concept of drawdown, which has its advantages, but also inconveniences

                  It is impossible to manage corrections because not only are they numerous, frequent, without pattern and unpredictable, and most importantly, occur in times of positive market cycles

                  How should we act on corrections? We should not chase the market, and we must maintain our course and rebalance

                  The definition of equity market corrections is situations in which the market depreciates between 10% and 20% since its previous peak or maximum level, also called technical corrections. When the stock market registers a loss of more than 20% it is said that we are facing a negative cycle, a crisis, or a bear market.

                  As we shall see, equity market corrections are usual, normal, and frequent. They succeed all or almost every year, and more than once a year.

                  To better picture this, we purposely chose the image of a 3,000-meter obstacle race.

                  Investing in equity markets is like a medium-distance race and with obstacles. It is not a 100-meter race, or an explosion. It is also not a race with barriers, which are predictable levels, because they are all the same, they all have the same height, they are the same distance, and each athlete runs on their track. And it be shorter than a 10,000-meter race, let alone a marathon, because you do not have to run such long distances to reach the finish line, which are our financial goals.

                  Equity markets show a very good historical performance, but not linear due to corrections

                  In the following chart we can see the evolution of 1 dollar invested in the US stock market (given by the S&P 500 index) between 1870 and 2020, in real terms or purchasing power, and on a logarithmic scale which means that each range equates to a doubling of the value:

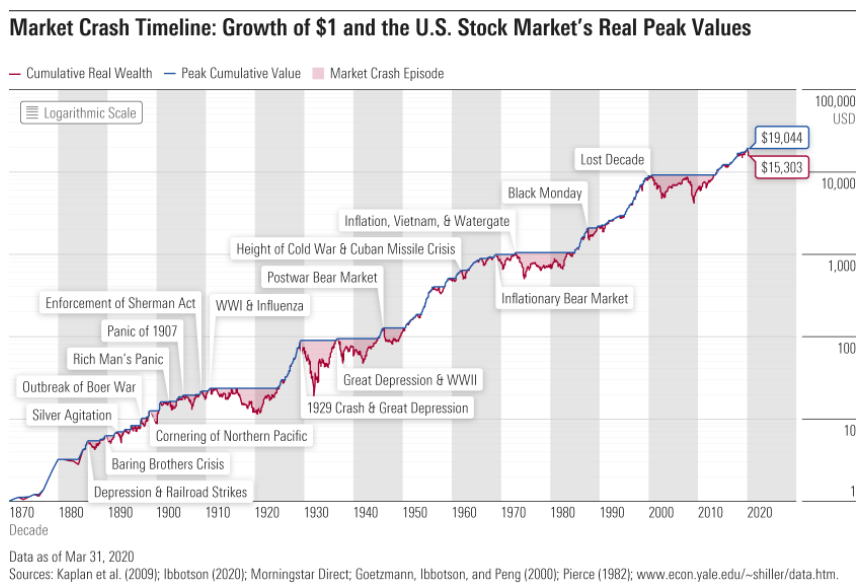
                  This dollar invested 150 years ago or 5 generations ago by our great grandparents or great-great-grandparents, would have resulted in more than $15,000 in March 2020, at the lowest level caused by the pandemic, after reaching a maximum of $19,000, in terms of purchasing power.

                  The real wealth created is enormous: more than 15,000 times in 150 years. It is equivalent to an annual real return of 6.5% per year (corresponding to a nominal return of 9% per year less an average annual inflation rate of 3%).

                  This 6,5% value looks like an almost linear evolution, but it is not (incidentally it is even known by Siegel’s constant).

                  In fact, there have been advances and setbacks. There are positive periods and there are negatives. There are long, medium, and short-term cycles.  There are periods of great expansion or wealth creation, such as 1870-1910, 1919-29, 1950-70, 1985-2000 and 2009-2020, as well as periods of great falls, such as the Great Depression of 1929, the technology bubble of 2000, and the Great Financial Crisis of 2007.

                  Although it is more difficult to detect, there are many more periods of more moderate climbs and less steep descents.

                  Market corrections of between 10% to 20% are frequent and often profound, and we need to know them to be prepared to go over them

                  The following graph shows 27 of the 28 corrections (between 10% to 20%) that have occurred since World War II to date (missing the recent March 2020 linked to the coronavirus crisis):

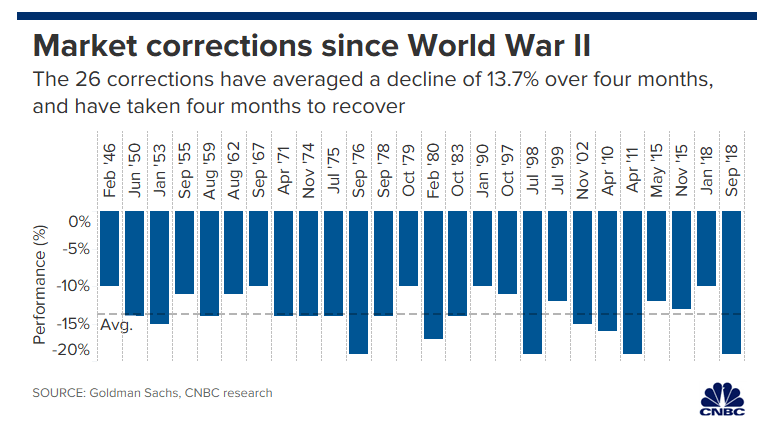
                  There were 26 corrections that on average recorded a devaluation of 13.7%. They had an average duration of 4 months and were also recovered in 4 months, on average.

                  The following table shows these crises in greater detail in the period from 1965 to 2018:

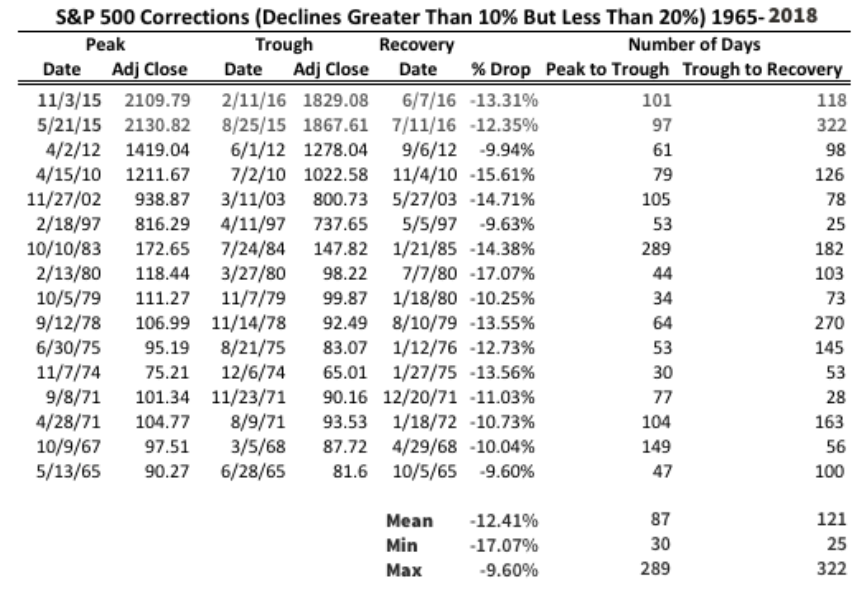
                  Most crises last less than 3 months, and there was only one very prolonged, that of October 1987 of almost 9 months. Falls are mostly 10% to 12%.

                  To try to better understand these situations the following chart shows the evolution of the S&P 500 index and the advanced ISM indicator in the period 1962 to 2020:

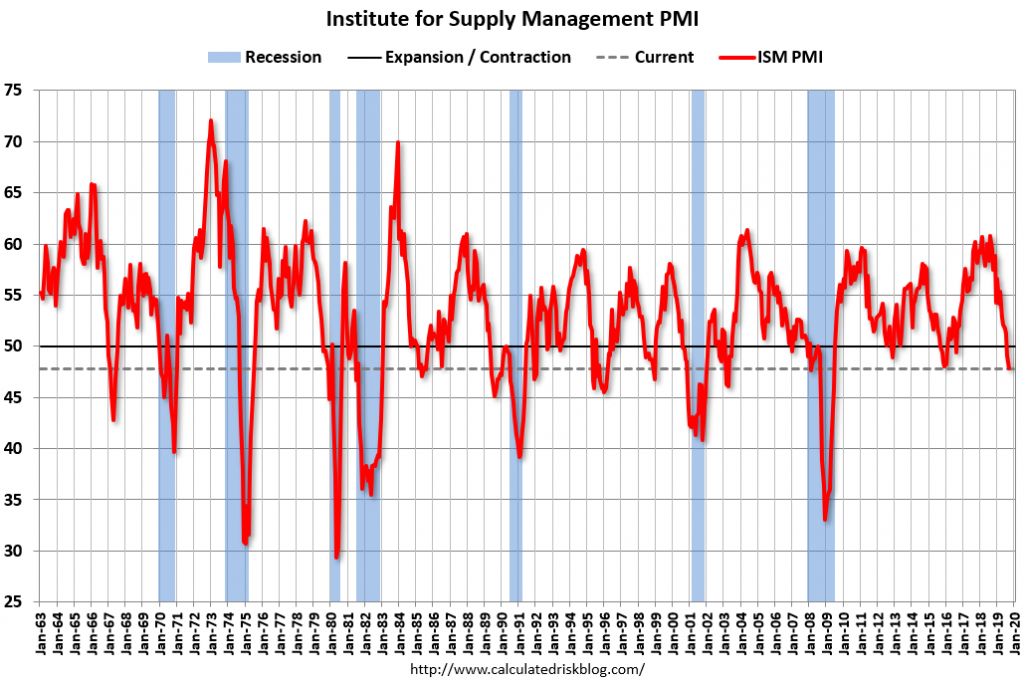
                  These are corrections that are not linked to economic recessions, as these give rise to major crises, negative cycles, or bear markets, with steeper declines.

                  They are usually associated with exogenous events, such as commodity shocks – oil and gold – or market events – economic policy changes, credit rating declines, etc. – and coincide with a slowdown in economic activity evidenced by the fall in ISM.

                  We often live and feel crises through the concept of “drawdown”, which has its advantages, but also inconveniences

                  The drawdown concept, measured as the negative deviation between a peak and the next minimum level, and associated with maximum potential loss is very useful for preparing, planning and establishing our central allocation of investments, being a good test of risk tolerance and defining the investor profile.

                  However, it is a bad indicator for us to live crises because it can become obsessive and destabilizing. During crises we often make calculations at everything like those of the drawdown, that is, how much we lose from the highest point of the market. This value often overshadows loss or even lower actual gains. There would be no harm with that if those values were considered as well. We rarely do the calculations to maximum potential gains. This makes us feel more the market’s losses than the gains and pushes us out away from it.

                  By definition, potential gains or losses are virtual realities. What matters are the actual gains and losses.

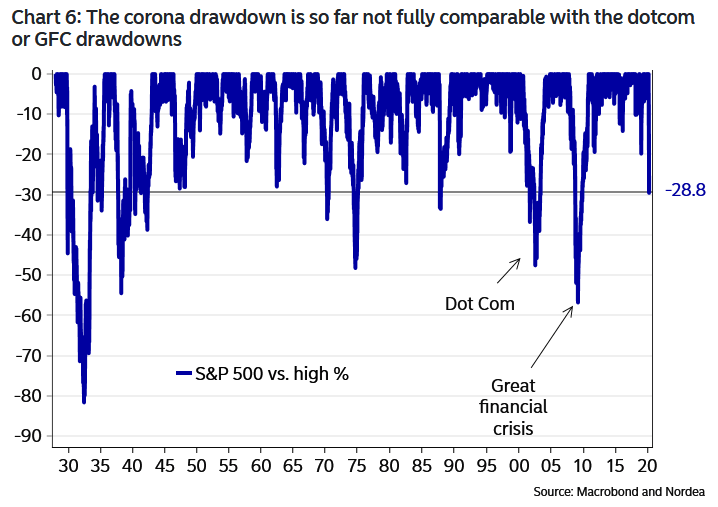
                  We highlight the strong devaluations of more than 80% in the Great Depression, almost 60% in the Great Financial Crisis and almost 50% in the technological bubble. The average drawdown was 28.8%. Rarely exceeded the 30% that marks a bear market. However, drawdowns of 10% to 20% are very frequent.

                  In graphic terms, it is necessary to keep in mind that each time the line touches the horizontal axis it is because there is a drawup, or an appreciation starting from the minimum level that has been fully retrieved and exceeded. 

                  It is impossible to manage corrections because not only are they numerous, frequent, without pattern and unpredictable, and most importantly, occur in times of positive market cycles

                  The following graph shows the annual returns and the largest intra-year returns seen by the S&P 500 between 1980 and 2020:

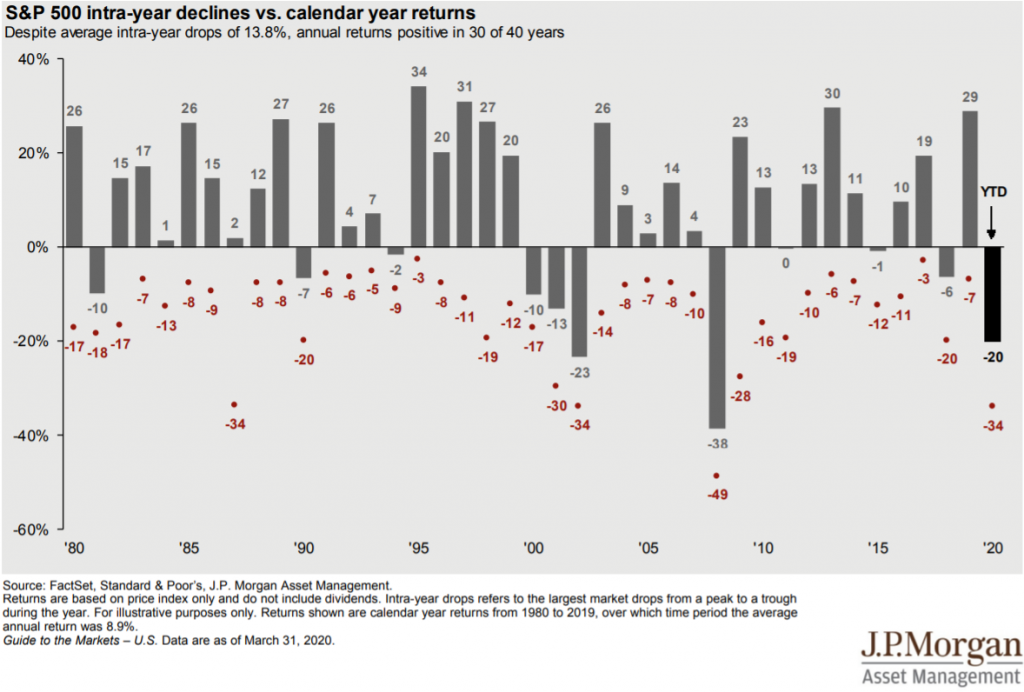
                  This chart helps put drawdowns in perspective and allows for other conclusions.

                  There are several occasions when the market losses more than 10% during a given year, but at the end of the year the market ends with positive returns, in some cases even quite positive and above 20%. Intra-annual volatility with this size and frequency is impossible to predict and anticipate.  

                  The following graph shows the annual returns, as well as the highest intra-year gains and declines of the S&P 500 index between 1979 and 2020:

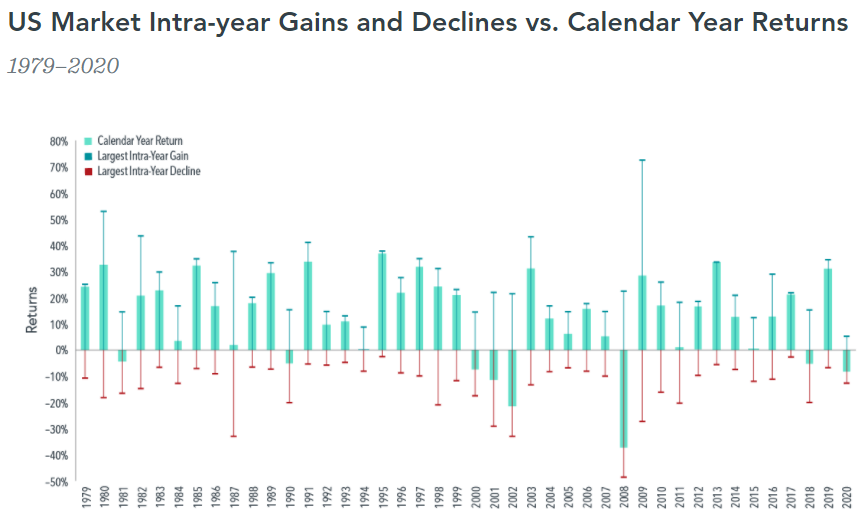
                  Not only are there several significant recoveries from intra-annual devaluations, but we can have very high gains during these years. The years 2009 and 1980 are extreme, but they are very illustrative of this reality. 

                  In addition to being impossible to predict corrections, the loss of the best market days has a huge cost.

                  The following chart shows the effect of losing some of the best days on the market on a $100,000 investment in the S&P 500 over the past 30 years: 

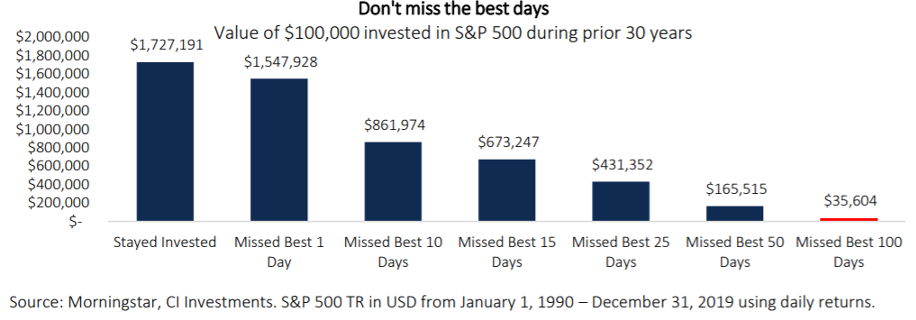
                  We must recall  that 30 years are 7,830 working days of market transactions.

                  If we were invested all the time the capital accumulated after 30 years would be $1,727,000. The loss of the best market day would have reduced that amount by $175,000 or 10%. However, the loss of the top 10 market days would have cut half the accumulated capital, and the loss of the top 15 days would represent a cut to almost 1/3. More serious still, missing out the 25 best days would be to lose 75%, and if it had been the 50 best days, the capital would be less than 10% to what would result if we were always invested. In an extreme case, the loss of missing the 100 best days would result in accumulated capital of $25,000, that is, an effective and large loss of invested capital of about 35%

                  If, on one hand, it takes a lot of bad luck to always miss the best days, it is also important to keep in mind that even 100 days are only 1.2% of the total days.

                  To aggravate the situation, the best market days usually arise during crises or even market crashes.

                  The following chart shows the daily valuations recorded in the S&P 500 between 1950 and 2020: 

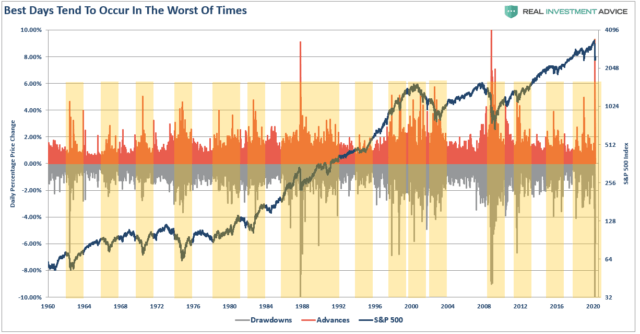
                  The two best market days, with 10% or almost appreciation, occurred in the middle of the great crises of 1968 and 2008. It is also easy to see that valuations above 4% have usually succeeded in times of crisis.

                  It is not surprising that in times of crisis, market volatility is very high. This uncertainty is another reason for being very difficult to predict and above all to manage the times of major corrections.  

                  How should we act on corrections? We should not chase the market, and we must maintain our course and rebalance

                  Thus, the question arises of how we should deal with market corrections.

                  We start by seeing what we should not do and that unfortunately is what we normally do: go after the market, that is, sell low and buy high.

                  The following chart shows the average 12-month net investment flows in the S&P 500 index (in bars) and the returns of the same 12-month index (online):

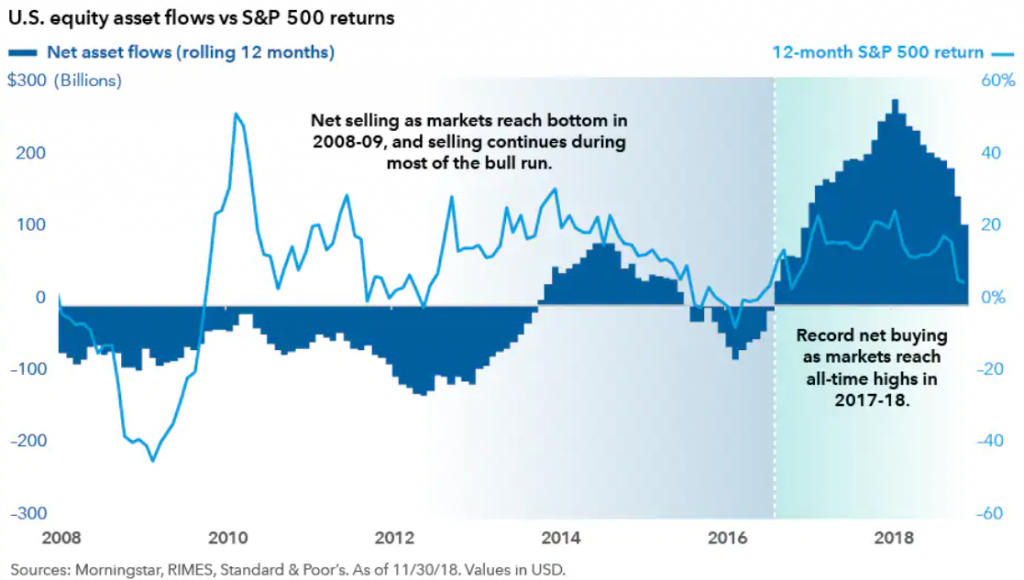
                  When the market fell in 2008 investors were selling more and more with the accentuation of losses. Net sales continued at the same pace until 2011 and with markets already recovering well. These sales increased when returns temporarily declined in 2012 and remained until 2014 despite a comeback to good levels of returns. It was only from that year that net purchases emerged and still timidly, 5 years after the end of the crisis. The return of investment to the markets occurred only in 2017, 8 years of strong market gains after the end of the Great Financial Crisis.

                  We see that most investors sell after the market falls a lot and buys after rising a lot. They sell at low levels and buy at high levels. It is the opposite of a good strategy.

                  This reality is the result of various behavioural biases, such as loss aversion, recency or short memory, the herding effect, media noise, etc… that are very difficult to recognize and combat.

                  The way to avoid these situations is to outline a good financial plan and based on a correct perception of the opportunities and risks of investments and our investor profile. If we are aware that we have prepared and thought about investments, it is easier to understand and act in these situations.

                  The action we must take in the face of corrections is to validate our decision to diversified asset allocation and maintain course by rebalancing.

                   The following graph seeks to typify the importance of a good, diversified allocation of assets and to maintain the course with rebalancing:

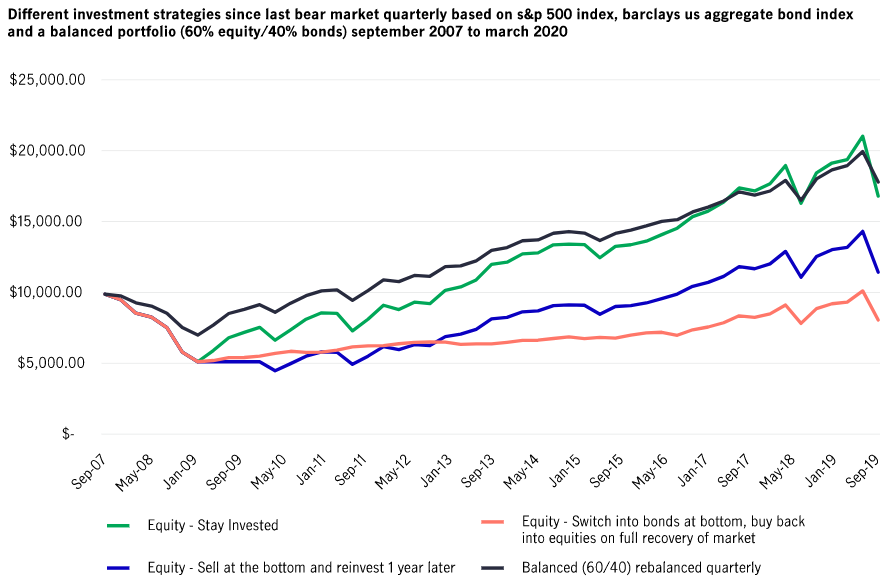
                  The situation shows the development of two investment strategies for an invested capital of $10,000 between September 2007 and September 2019, one 100% in equities and another of 60% in s and 40% in bonds, with quarterly rebalancing.

                  At the end of the period, the result of the two strategies would be the same, a capital of $17,000 or a 70% appreciation. However, the 60%/40% diversification strategy in stocks and bonds, respectively and with rebalancing, would have had lower volatility than that of 100% in stocks.

                  We also see what the results of trying to manage the timing in the 100% investment strategy would be in the context of market fluctuations. If the entire portfolio had been sold at the minimum level and reinvested a year later, the final capital would be $12,000. And if you had made a rotation to bonds at the minimum level and returned to the initial allocation after the full recovery of the stock market, the final capital would be $8,000, lower than the initial $10,000.   

                  In the face of a crisis, what we must do is what must always be done: to rebalance. Obviously, in a crisis, rebalancing becomes even more important.

                  We cannot allow the allocation of assets or investments to be overly altered in the face of large market fluctuations. Rebalancing should be done periodically, preferably once a year, and whenever the composition of the two main asset classes, stocks and bonds departs from the tolerance level of 5% or 10% of the initial allocation established.  

                  The following chart prepared by UBS shows the effect of rebalancing on a portfolio of investments of 60% S&P 500 equities and 40% treasury bonds between 2007 and 2017 for a tolerance level (or drift) of 5%:

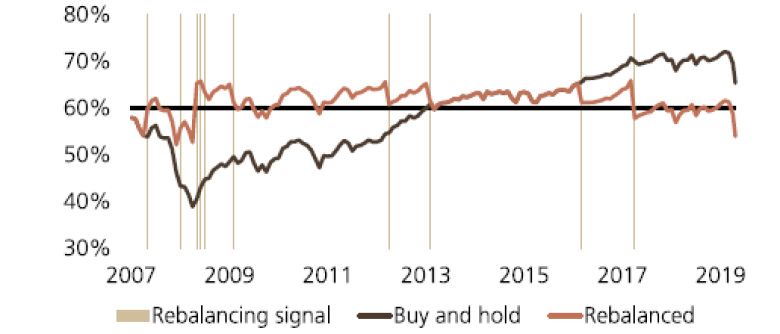
                  In this case, rebalancing is done whenever the allocation of 60/40 diverts beyond 5 percentage points in absolute terms.

                  The following graph shows the impact of rebalancing on portfolio performance:

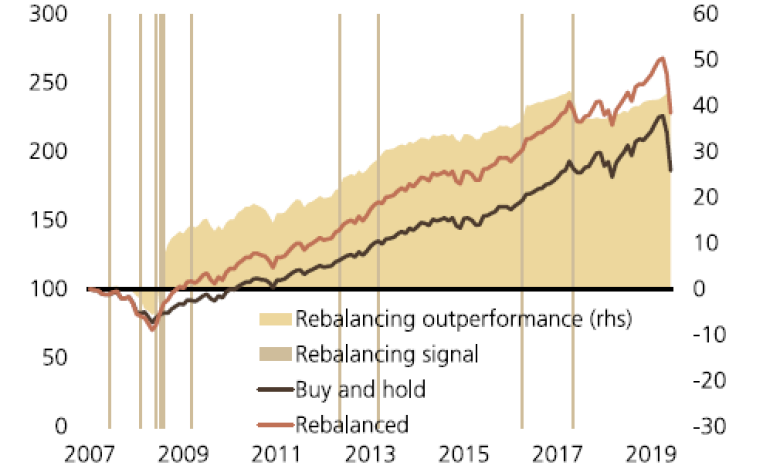
                  Rebalancing has a clearly stabilizing or buffering effect of the risk of major crises. In this case, it has even provided better performance, although this is not its goal and does not always happen. Its function is to reduce the risk. And it does so by pursuing a winning investment strategy, buying cheaper, and selling more expensive!

                  Previous Post

                  Investing in Cryptocurrencies Series: Part 2 Series – A brief history

                  Next Post

                  Investing in indices: The main indices of bond markets by issuer type and credit rating

                  Investadmin

                  Investadmin

                  Related Posts

                  Simple Portfolio Series (DIY) Part 2: The Traditional Portfolio 60/40, what it is, for whom, and its performance
                  Investing Series Guide

                  Simple Portfolio Series (DIY) Part 2: The Traditional Portfolio 60/40, what it is, for whom, and its performance

                  28 de January, 2023
                  Simple or Lazy Portfolio Series (DIY): Part 1 – Overview
                  Investing Series Guide

                  Simple or Lazy Portfolio Series (DIY): Part 1 – Overview

                  28 de January, 2023
                  Choosing Mutual Funds Series: Part 5 – Funds availability and currency of investment
                  Investing Series Guide

                  Choosing Mutual Funds Series: Part 5 – Funds availability and currency of investment

                  24 de January, 2023
                  Maximize time invested in the stock market instead of market timing: Part 2. Impossibilities and losses (cont.)
                  Investing Series Guide

                  Maximize time invested in the stock market instead of market timing: Part 2. Impossibilities and losses (cont.)

                  21 de November, 2022
                  Maximizing time invested in the stock market instead of market timing: Part 1 – Biases and losses
                  Investing Series Guide

                  Maximizing time invested in the stock market instead of market timing: Part 1 – Biases and losses

                  21 de November, 2022
                  ESG Investing Series: Part 9 – Developments and models of corporate governance regulation in the world
                  Investing Series Guide

                  ESG Investing Series: Part 9 – Developments and models of corporate governance regulation in the world

                  15 de August, 2022
                  Next Post
                  Investir em fundos índices: Os índices obrigacionistas por tipo de emitente e rating de crédito

                  Investing in indices: The main indices of bond markets by issuer type and credit rating

                  Leave a Reply

                  Your email address will not be published. Required fields are marked *

                  Trending

                  How Women invest: Part 2 – The results are equivalent to those of men, but with significant differences in investment management

                  How Women invest: Part 2 – The results are equivalent to those of men, but with significant differences in investment management

                  2 de March, 2023
                  Outlook 2023: Part 5 – 2023 will be a transitional year with two halves

                  Outlook 2023: Part 5 – 2023 will be a transitional year with two halves

                  17 de February, 2023
                  Outlook 2023: Part 4 – In changing economic cycle, policies, and market sentiment, valuation matters become more than ever

                  Outlook 2023: Part 4 – In changing economic cycle, policies, and market sentiment, valuation matters become more than ever

                  17 de February, 2023
                  Outlook 2023: Part 3 – 2022 was bad for investments, but was not the same for everything

                  Outlook 2023: Part 3 – 2022 was bad for investments, but was not the same for everything

                  16 de February, 2023
                  Investorpolis

                  We developed this blog because we believe that only a small learning effort is needed to make a big change in the decisions and results of our investments and financial assets.

                  Main categories

                  • Investing Series Guide
                  • Wealth and Investing
                  • Retirement & Savings
                  • Tools
                  • More

                  Newsletter

                  Sign to our mailing list to receive updates direct to your inbox!

                  *We don’t spam

                  • Privacy Policy
                  • Cookie Policy
                  • Contacts

                  © 2021 - Investorpolis / Powered by Delta Soluções

                  • pt-pt Português
                  • fr Français
                  • es Español
                  • en English
                  • Home
                  • Investing Series Guide
                    • I. Goal Based Investing
                    • II. Compounding & Inflation
                    • III. Assets Risks & Returns
                    • IV. Efficient Diversification
                    • IX. Sustainable Investing and ESG
                    • V. The Investor
                    • VI. Assets and Investments
                    • VII. Index Funds
                    • VIII. Successful Investing
                    • X. Kits and Tips
                    • XI. Other Topics
                  • Retirement & Savings
                    • Retirement
                    • Savings
                  • Wealth and Investing
                    • Investing
                    • Wealth
                  • Tools
                    • Calculators
                    • Publications
                    • Sites and apps
                  • More
                    • Best of
                    • Reviews
                    • Snapshots
                    • Others
                  • About us
                    • Who we are
                    • Mission
                  • Login
                  • Sign Up
                  • Cart

                  © 2021 - Investorpolis / Powered by Delta Soluções

                  Welcome Back!

                  Login to your account below

                  Forgotten Password? Sign Up

                  Create New Account!

                  Fill the forms bellow to register

                  All fields are required. Log In

                  Retrieve your password

                  Please enter your username or email address to reset your password.

                  Log In
                  We use cookies on our website to give you the most relevant experience by remembering your preferences and repeat visits. By clicking “Accept All”, you consent to the use of ALL the cookies. However, you may visit "Cookie Settings" to provide a controlled consent.
                  Cookie configurationCookie PolicyAcceptReject
                  Manage consent

                  Privacy Overview

                  This website uses cookies to improve your experience while you navigate through the website. Out of these, the cookies that are categorized as necessary are stored on your browser as they are essential for the working of basic functionalities of the website. We also use third-party cookies that help us analyze and understand how you use this website. These cookies will be stored in your browser only with your consent. You also have the option to opt-out of these cookies. But opting out of some of these cookies may affect your browsing experience.
                  Advertisement
                  Advertisement cookies are used to provide visitors with relevant ads and marketing campaigns. These cookies track visitors across websites and collect information to provide customized ads.
                  Analytics
                  Analytical cookies are used to understand how visitors interact with the website. These cookies help provide information on metrics the number of visitors, bounce rate, traffic source, etc.
                  Functional
                  Functional cookies help to perform certain functionalities like sharing the content of the website on social media platforms, collect feedbacks, and other third-party features.
                  Necessary
                  Necessary cookies are absolutely essential for the website to function properly. These cookies ensure basic functionalities and security features of the website, anonymously.
                  Others
                  Other uncategorized cookies are those that are being analyzed and have not been classified into a category as yet.
                  Performance
                  Performance cookies are used to understand and analyze the key performance indexes of the website which helps in delivering a better user experience for the visitors.
                  SAVE & ACCEPT

                  Add New Playlist

                  Are you sure want to unlock this post?
                  Unlock left : 0
                  Are you sure want to cancel subscription?