The main indices of the Chinese stock market
China is the proven proof that the economy and stock markets are very different realities: in the last 4 decades, an economic growth of 9% per year has been accompanied by a market appreciation of 1% to 2% per year, depending on the indices considered
The boom: Between the creation of the Shanghai stock market in 1992 and 2018, the Chinese stock market appreciated 300%, more than the S&P 500
The bust: Since 2018, the Chinese stock market has lost 50% and is now at lows, while the S&P 500 and Nikkei 225 are at highs
This article is part of a series dedicated to investing in Chinese stocks.
In the first article, a general introduction to the topic was made,including a synthesis of the remarkable performance of economic growth and development in the last 4 decades, as well as the challenges it has faced especially since mid-2015.
In the second article, aspects of China’s strong economic growth over the past 4 decades were developed.
In this third article we will detail the behavior and developments of the Chinese stock market.
In previous articles we have already developed the size and weight of the Chinese economy in global terms, its enrichment in recent years, as well as its convergence with the most developed countries.
Also in previous articles we have addressed the growth of investment in emerging equity markets, as well as their attractiveness, with emphasis on the Chinese market.
In another article, we also delved into the specifics of the structure, functioning and activity of the Chinese stock market.
The main indices of the Chinese stock market
The Shanghai Composite Index (SSE Composite Index, also known as the SSE Index) is the stock market index of all stocks (including category A stocks and B shares) that are traded on the Shanghai Stock Exchange, established in 1990.
The Hang Seng is the index of Chinese companies based on the Hong Kong Stock Exchange, which aims to attract international investment, and is a highly liquid stock market domiciled in a developed country.
There are also indices based on a range of stocks with a focus on mega-caps, the most well-known of which is the CSI 300, which is a mix of the top 300 stocks traded on the Shanghai and Shenzhen Stock Exchanges, weighted by capitalization (the CSI 300 has been volatile since launch, with big spikes in 2015 and 2021, followed by sudden reversals).
The MSCI China Index (USD) targets large- and mid-cap stocks, comprising 740 constituents, including Chinese stocks of various categories and listed both domestically and overseas.
China is the proven proof that the economy and stock markets are very different realities: in the last 4 decades, an economic growth of 9% per year has been accompanied by a market appreciation of 1% to 2% per year, depending on the indices considered
From 1993 to 2020, China’s gross domestic product grew by more than 9% per year, nearly 40 times.
To the surprise of many, this kind of growth has not translated into fabulous returns for investors in Chinese equities.
Over the same period, the MSCI China index gained just 2.71% on an annualized basis.
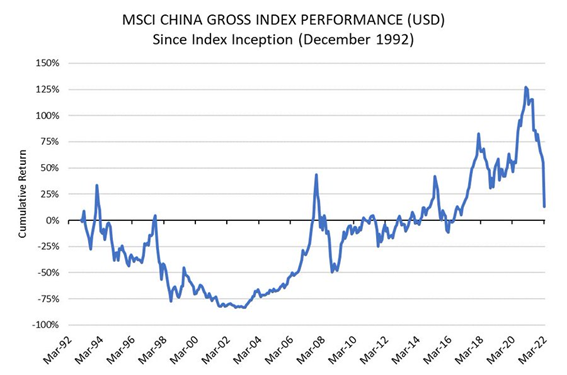
Returns on Chinese equities have been just as disappointing or even more disappointing relative to other major markets.
During this 27-year period, the MSCI USA index has increased by 10.37% per year, the MSCI Emerging Markets index by 7.95% and the MSCI EAFE index by 6.65%.
The following chart shows the relative poor performance of the MSCI China index for each of these three indices:
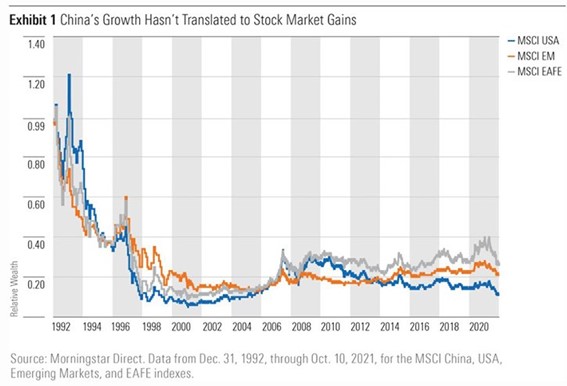
Comparatively, between 1992 and 2020, China lost more than 80% of its value to the US, 80% to emerging markets and 70% to the European, Australasian and Middle East (EAFE) markets.
The following chart shows the performance of the indices of the Chinese Hang Seng stock markets and the major world indices since 1994:
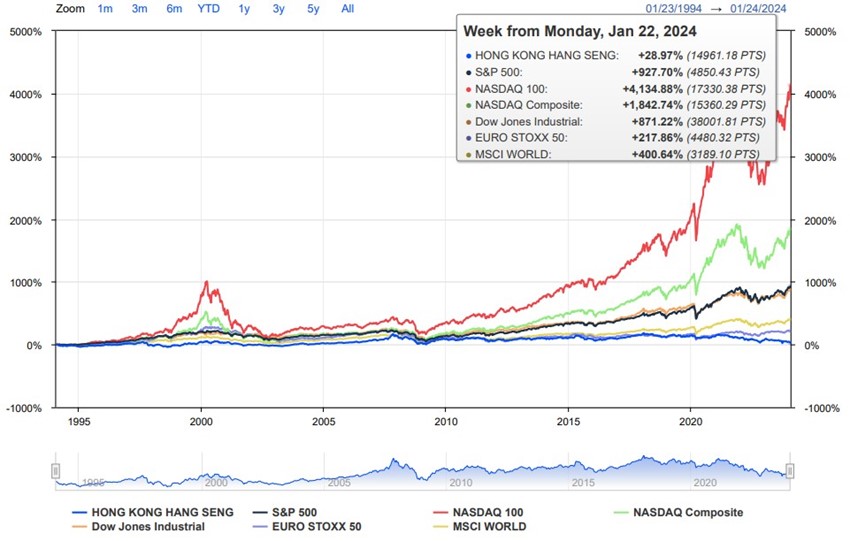
In these 30 years, the Hong Kong stock market index, the Hang Seng, has appreciated by only 29% while the S&P 500 has gained 927%, the Nasdaq 100 by 4.135%, the Eurostoxx 50 by 218% and the world by 400%.
Obviously, economics and markets are directly linked.
However, there are cycles and times when there are disconnects.
The boom: Between the creation of the Shanghai stock market in 1992 and 2018, the Chinese stock market appreciated 300%, more than the S&P 500
Between 1992 and 2018, the Chinese stock market experienced a boom period, tripling in value in just over 20 years:
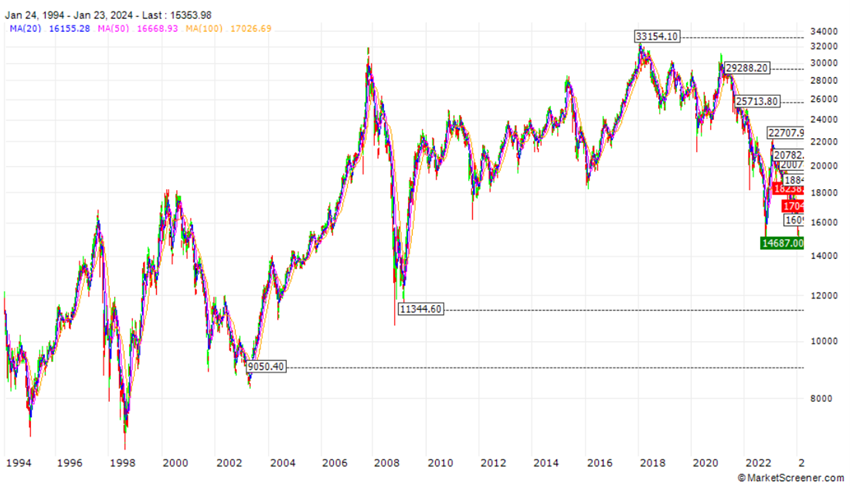
The bust: Since 2018, the Chinese stock market has lost 50% and is now at lows, while the S&P 500 and Nikkei 225 are at highs
In 2015 it has a 40% drop, which was the first warning, and since then it has barely recovered:
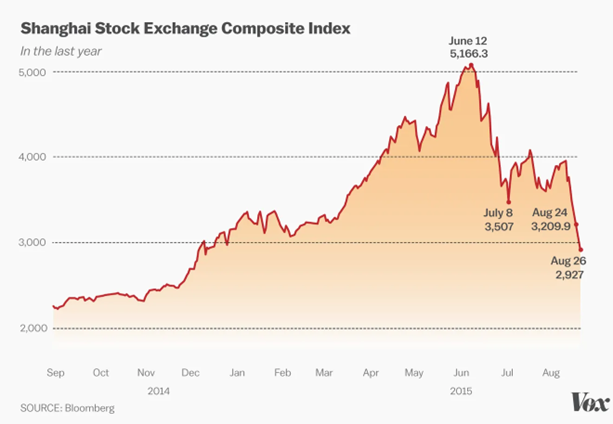
The mid-2015 crash stemmed from the authorities’ regulatory actions on the markets to put an end to the previous year’s financial exaggerations in which it rose 150%.
The government limited the number of loans made to individuals for the purchase of shares that led to the opening of 40 million investor accounts between 2014 and 2015:
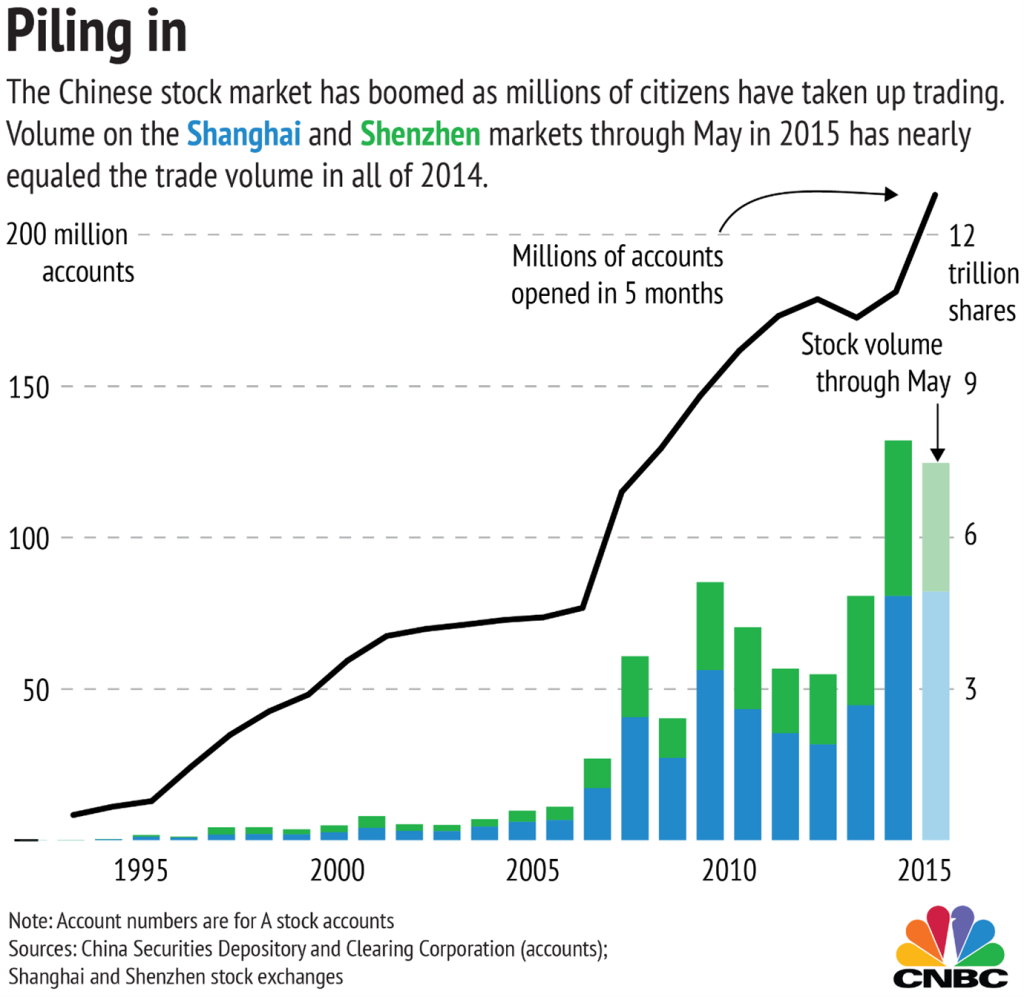
At the end of August, after this abrupt drop, the government launched several measures to support the market, such as support for the main brokers, a ban on sales by investors with more than 5% and managers, and encouraged the purchase of own shares by companies.
The market still managed to recover a little, but the fall continued in 2018 until today:
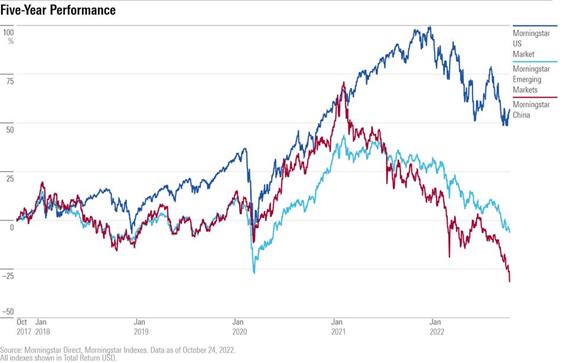
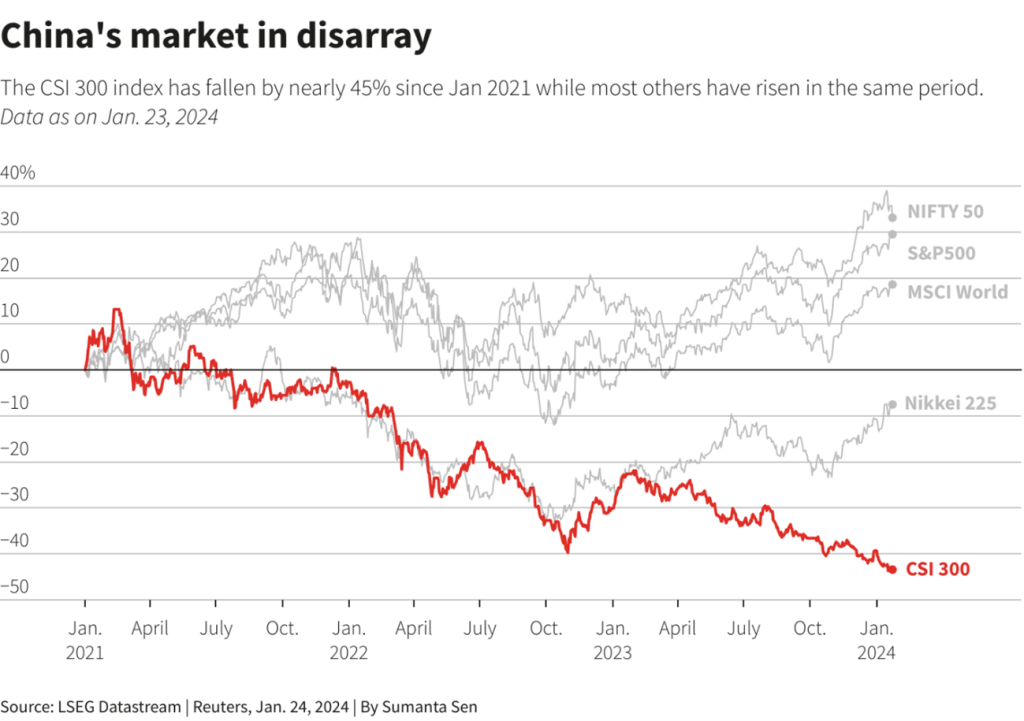
Last year, the Chinese market again lost more than 10%, compounding losses to more than 50% since the summer of 2015:
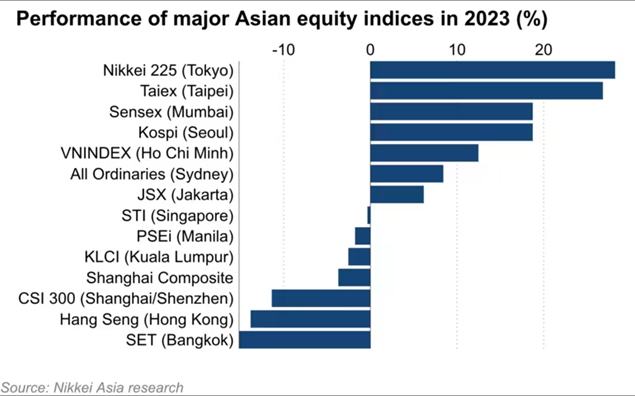
The Chinese stock market is at 7-year lows, while the U.S. and Japanese markets are at all-time highs.
In the following articles we will dissect each of these aspects and the consequences regarding the interest of the Chinese stock market for foreign investors.
This central question of the attractiveness of the Chinese market is very pertinent because, as we know, investing well means diversifying risks, doing so, above all, in the world’s largest economies and companies, and privileging those that are world leaders and consumer goods, in order to put the economy to work for us.


