


It is important to do so because we are living and witnessing a change of regime or structural paradigm, to a situation that is new and that many have never lived.
In the initial article we made the introduction and presentation of the approach to the theme.
In the second article we showed what happened in 2022, from a more global perspective of the development and performance of economic cycles and financial markets.
In this article we will analyze the year 2022 in more detail, to try to identify the factors and consequences of this paradigm shift, at the conjuncture and structural levels.
The goal is to understand what works in this cycle change, so that we can better design the future.
2022 was very difficult for investors
The losses were large in investments in stock and bond markets.
Nominal returns were negative in almost all investments.
There was no possibility of refuge, or capital protection.
Cash was one of the best investments.
High inflation, between 8% and 10%, considerably aggravates the situation, causing devaluations in net worth in that same amount.
Every year our assets lose the value of inflation.
Even if it drops to more modest levels, while above 2%, the losses are significant.
We have known for a long time that inflation is one of the main reasons we invest.
And the higher inflation, the more important it will be to invest.
If we do nothing, we lose purchasing power and quality of life.
Although the overall picture in 2022 was negative, there was a dispersion in the returns of investment in the main classes and subclasses of assets, which should kept in mind.
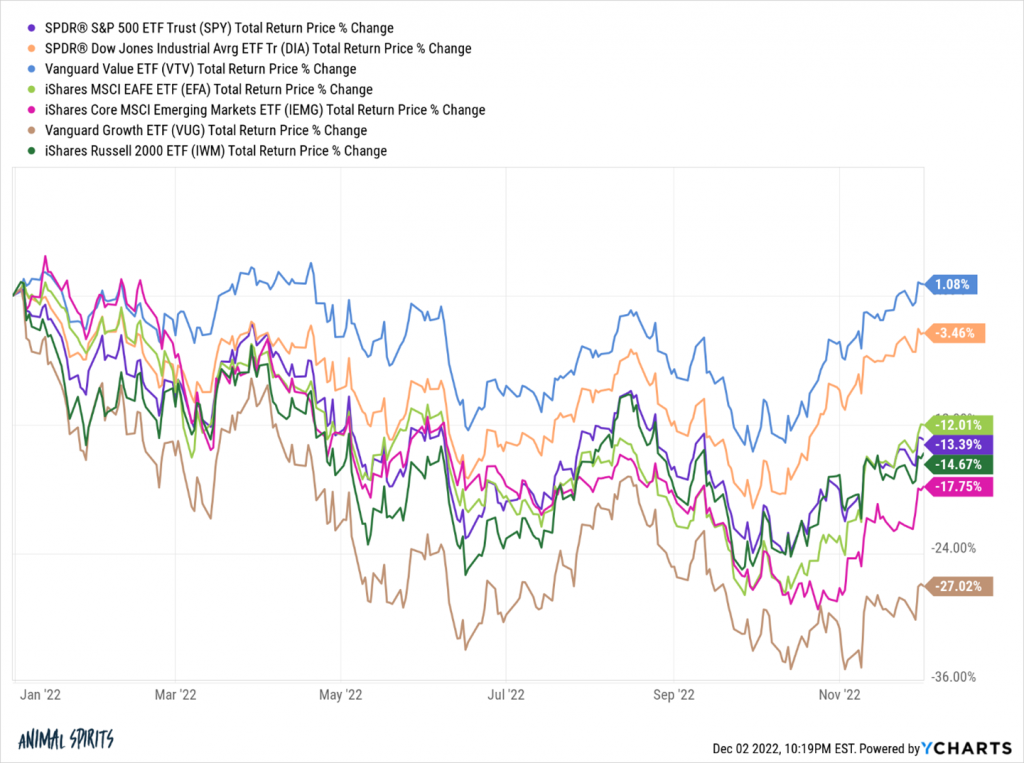
As for the equities markets, the Dow Jones lost was small, compared to the S&P 500, and even less relative to the Nasdaq.
The remaining major geographic indexes did not perform much differently from the S&P 500.
In terms of investment styles, the differences are greater.
The value strategy performed much better than growth.
Small capitalisations performed worse than large ones.
The dispersion at the level of mega capitalizations was enormous.
Looking at this dispersion is important for us to understand what works in changing the economic cycle of growth and inflation and the regime of interest rates and economic policies.
In addition, this analysis allows evaluating the path that is being made between the losing investments and the winners, throughout the cycle change.
This assessment helps to anticipate and project the performance of the various assets and investments in the future, being useful for preparing and positioning our portfolio in its various phases.
2022 was a difficult year for investments with sharp losses in major stock and bond markets, but dispersion was large
The following chart shows the periodic table of investment returns of the main assets of the last 10 years, inflaming the green positive and reddes the negative ones:
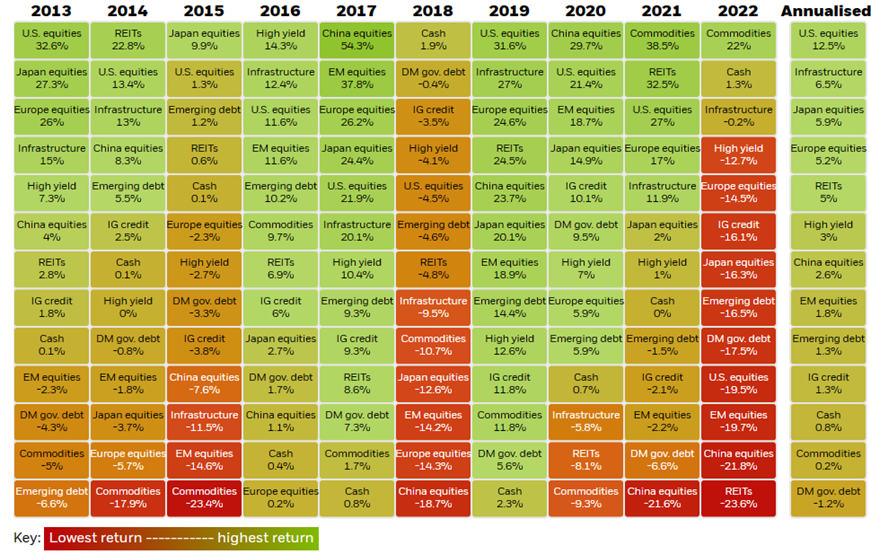
The disastrous year 2022 is easily noticeable.
Of the 13 asset subclasses presented, there are only 3 positive, commodities with 22%, and monetary and real estate investments with values close to zero.
All others are red and with losses ranging from 12.7% to 23.6%.
That is, the wipe out was general. We lost in everything or almost everything. Which might make us think it was all the same. Anyway, we’ll see it wasn’t like that.
It is also quite noticeable the extraordinary performance that happened in previous years.
Almost all assets have had positive and very high returns in the last 10 years.
All we have to do is focus on the rightmost column that shows the average annualised returns in this period.
In 4 assets were higher than 5%, with U.S. equities with 12.5%.
As we have seen, the year 2022 was not normal, when framed in the last 10 years.
The following graph concludes that even over a longer 50-year horizon between 1977 and 2022, the simultaneous underperformance of stocks and bonds that has occurred in the last year is a clear exception:
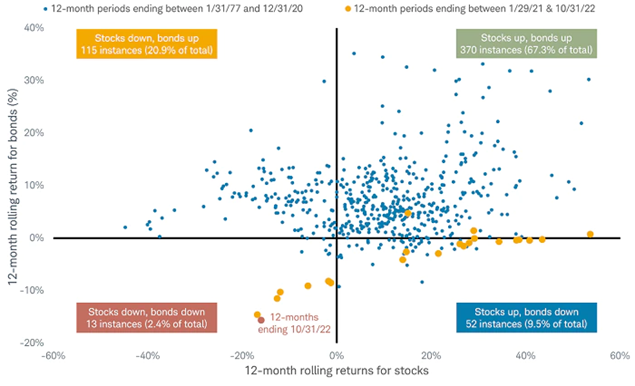
Source: After a Bad Year, Should You Still Own Bonds?, Charles Schwab, November 1, 2022
The average 12-month rolling returns of stocks and bonds in this period are concentrated in the upper right quadrant of simultaneous stock and bond gains, which occurred in 67% of cases.
The following scenario of higher frequency of occurrence is that of the fall of the stocks accompanied by the appreciation of bonds, in 20% of the situations. The inverse scenario was 9.5% of the total.
In fact, only in 2.4% of the periods (13 out of 600 situations), there was a similar situation to 2022, of simultaneous devaluation of the stock and bond markets.
2022 reminded us that not all major stock indices are the same, including for the three major U.S. indices
For many years, the differences in returns of the three major indices of the U.S. stock market were not so large:
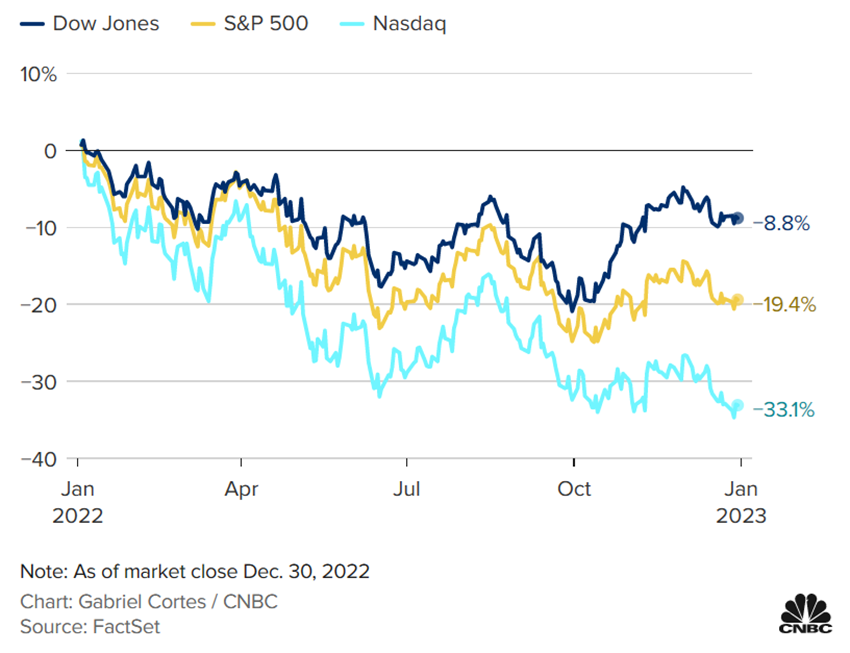
In 2022, the Nasdaq lost 33%, the S&P 500 19% and the Dow 9%.
This dispersion is abnormal and huge, especially in a year of losses.
The following graph shows the comparative evolution of the 3 major U.S. indices between 2000 and 2022:
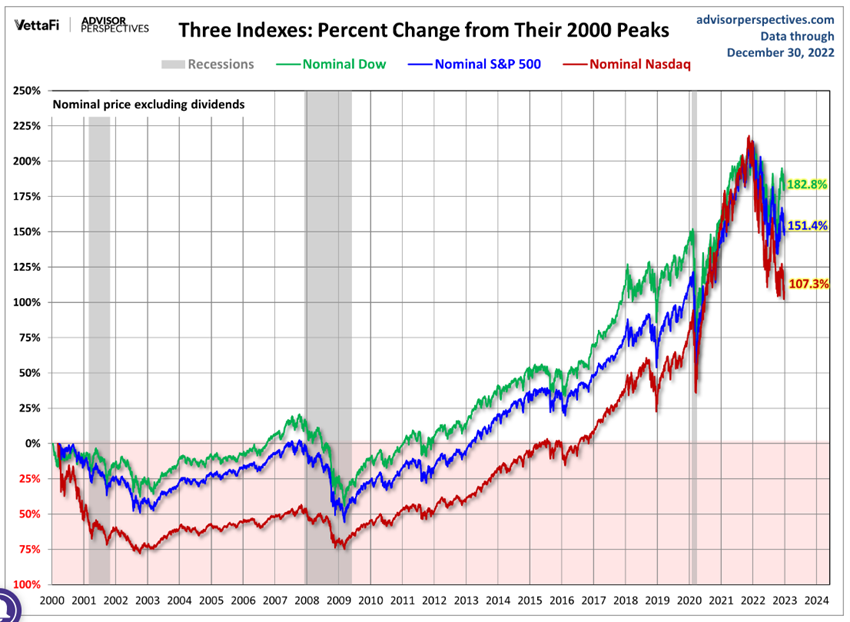
In the total of this 22-year period, the Dow gained 182%, exceeding the 151% of the S&P 500 and 107% of the Nasdaq.
During this period it is evident that there were differences in the behavior of the indices at certain times, but these differences were rarely as marked as in 2022.
Another similar exception was precisely that of the tech bubble, visible at the beginning of the period, which caused a sharp 75% devaluation of the Nasdaq, compared with 50% of the S&P 500 or less than 30% of the Dow Jones.
In the Great Financial Crisis of 2007-08, the situation was also similar, though less pronounced.
This large dispersion in 2022 shows that there was a differentiated behavior at the level of the components of the 3 indexes.
And it is important that we look at these differences in order to better understand the effects on the various actions, even limited to the largest companies and to a single country, the US, of the change in the economic cycle, growth, inflation and monetary policies.
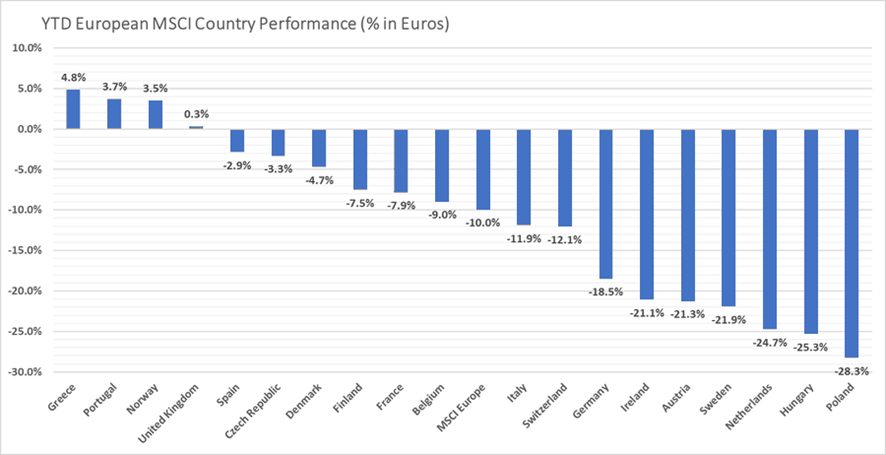
This is because in the other developed countries the same was true:
The different composition of the constituents immediately gives us the answer.
In other articles we addressed the compositions and performances of those three indices over time, from the Dow Jones, the S&P 500 and the Nasdaq.
The big difference is the sectoral composition.
The Dow Jones is more concentrated in industrial, consumer and financial companies.
The S&P 500 is the most diverse by industries, having a bit of everything.
The Nasdaq is sharply technological, also giving greater weight to other equally more cyclical sectors.
Differences in sectoral composition from major European indices and other regions or countries are also very significant.
In other words, the cycle change caused changes in the performance of the various sectors that were designed in the performance of the indexes, due to their different composition.
In a previous article we had already explored the issue of economic cycles and investment performance.
The following link summarizes the differences between the S&P 500 and Dow Jones IA indices:
https://www.spglobal.com/spdji/en/research-insights/index-literacy/the-sp-500-and-the-dow/
In previous articles, we have described and deepened the characteristics of each and differences between these 3 indices, the Dow Jones Industrial Average, the S&P 500 and the Nasdaq 100.
There were styles and factors that did well and others that failed
The following chart introduces the theme, showing the huge dispersion of some of the major indexes of the U.S. stock market:
There are noticeable differences between the performance of these major indexes that are worth deepening.
#1 Cyclical sectors, such as communications and technology, performed poorly, while energy performed excellently
The two issues – the composition of indices and styles of value and growth – are closely linked to the theme of the sectors of activity.
The sectors in the S&P 500 performed as follows:
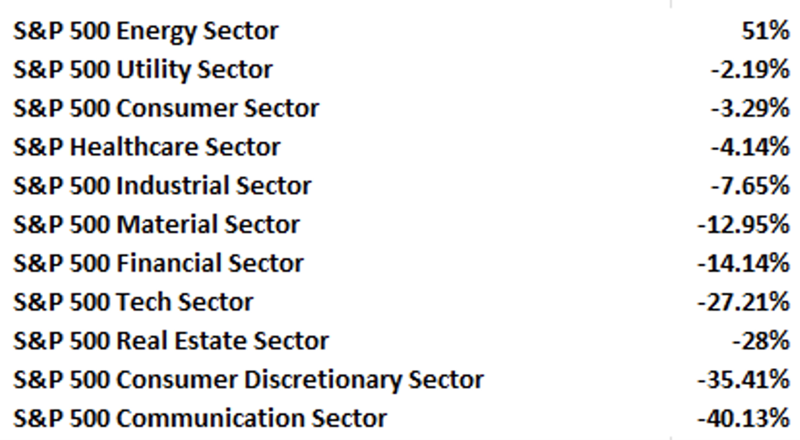
The most cyclical sectors, including technology, real estate, durable consumer goods and communications, had sharp losses of between 27% and 40%.
Energy gained 51%, continuing what has happened in 2021, and reinforced by the Ukrainian war.
The defensive sectors such as utilities, consumer goods, health and industry had lower losses, between 2% and 8%.
The following graph makes this even more evident:
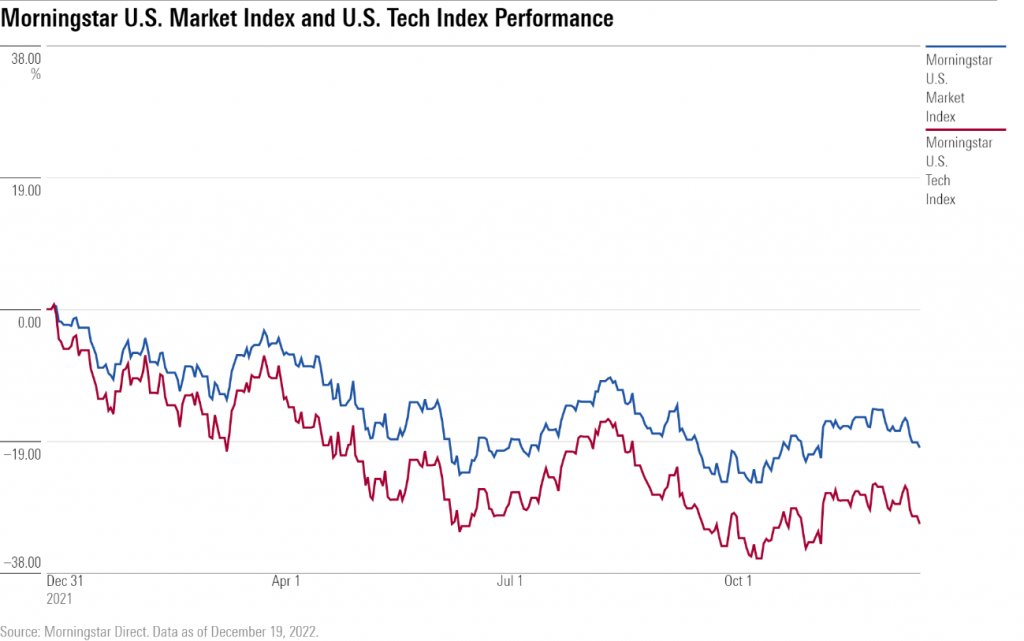
While the global index of the U.S. market Morningstar US Total Market, fell about 19%, the technological Morningstar US Tech fell more than 30%.
#2 Value strategies have beaten growth, continuing that in 2021
In 2022, in the change of economic cycle, with less growth, more inflation, and higher interest rates,the of value stocks clearly beat the growth stocks:
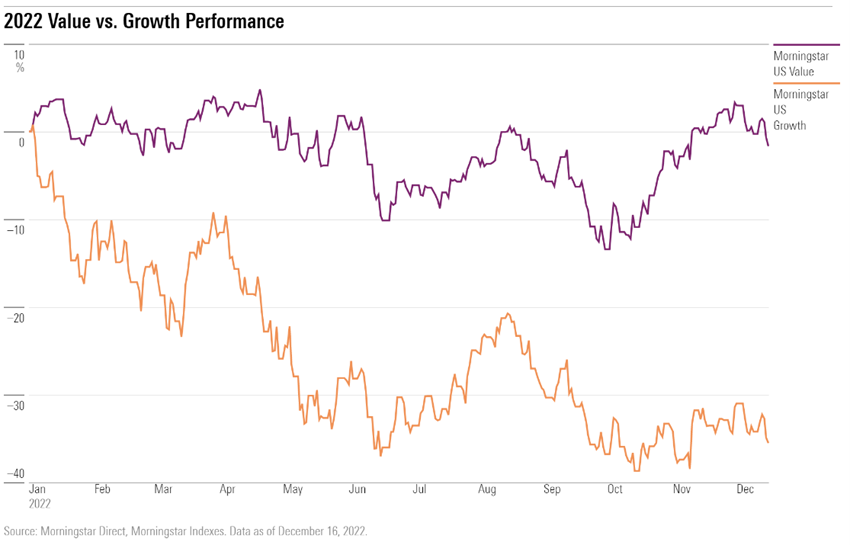
The S&P 500 Morningstar US Value value index performed zero and the Morningstar US Growth growth index fell 33%.
This situation is natural and expected.
Value behaves better than growth in situations of economic growth slowdown.
In two previous articles we presented the meaning and analyzed the behavior of value and growth investments.
#3 Large capitalisations were also slightly better than small and medium-sized
Large company shares, or capitalizations, performed better than small and medium-sized capitalizations, as expected in an environment of greater risk aversion.
#4 Fashion investments such as meme stocks, crypto currencies, ARK and similar funds and SPAC and even IPOs have experienced worse times
Of course, the investments of euphoria, or fashion, of recent years have been the ones that have had the greatest losses.
It has been proven that in a shift or cycle change, the higher the climb, the higher the fall.
This situation was expected, as we said in the various articles devoted to the excesses of the markets, or financial irrationality.
We mentioned what would happen and how it would end when it started in mid-2020 and we showed how it has been going on at the end of 2022.
What happened to the meme actions is well illustrative of these excesses:
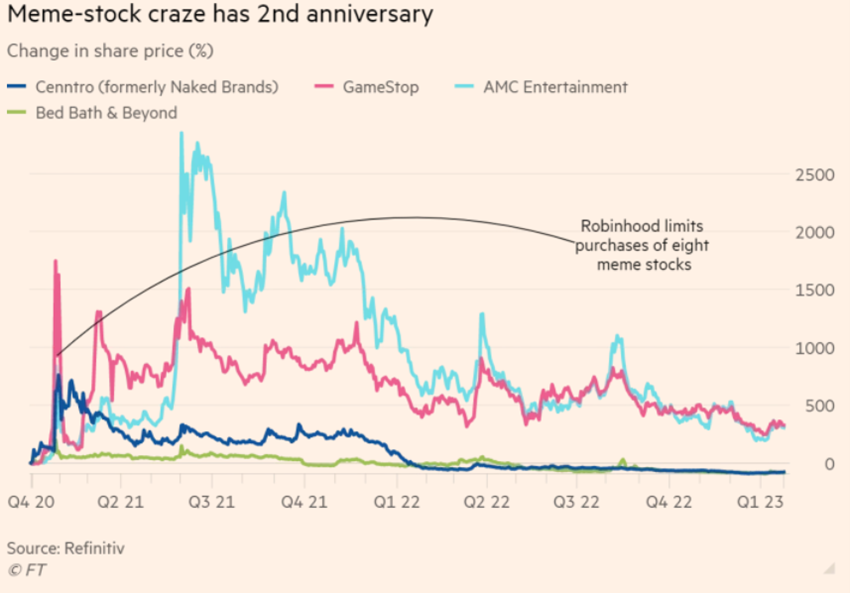
These meme stocks are stocks that were in great financial difficulties at the end of 2020.
Suddenly, a movement of investors mobilized through social networks gave rise to huge volumes of purchases and caused prices to skyrocket, benefiting from being stocks with large short positions of institutional investors that were covered to limit losses.
Only 8 of the major meme stocks – AMC, Gamestop, Bed Bath & Beyond, Naked Brands, Blackberry, Nokia, Koss and Express – reached a valuation of $7.5 billion at its peak.
Some seized the moment and mobilized a total of $4.7 billion.
Since then, the correction has come.
Bed Bath & Beyond has announced that it may file for bankruptcy.
Still, there are actions such as Gamestop and AMC that have mobilized capital and remain well above the 2020 final values.
When liquidity abounds, unprofitable companies can survive for a long time, as long as they can finance themselves in the capital market, to the point where the music stop.
Ark investment funds managed by Cathie Wood gained prominence in 2020 by bringing the idea of investment innovation to the minds of individual investors and investing in technologies considered disruptive, with excellent results this year:
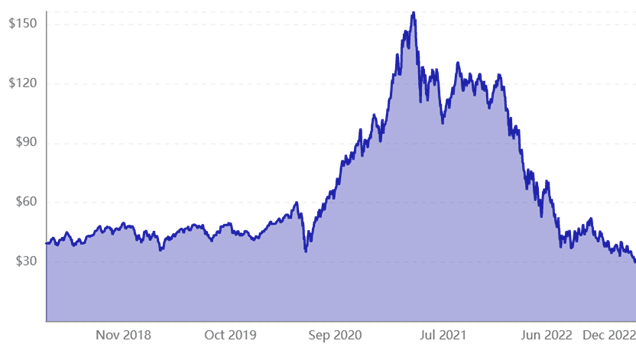
However, many of these stocks have begun to fall since mid-2021.
In 2022 alone, the main fund, ARK Innovation, lost 65% of its value.
Finally, Bitcoin and the other cryptocurrencies performed an extraordinary performance between 2020 and 2021.
However, bitcoin has lost 75% of its value since its maximum:
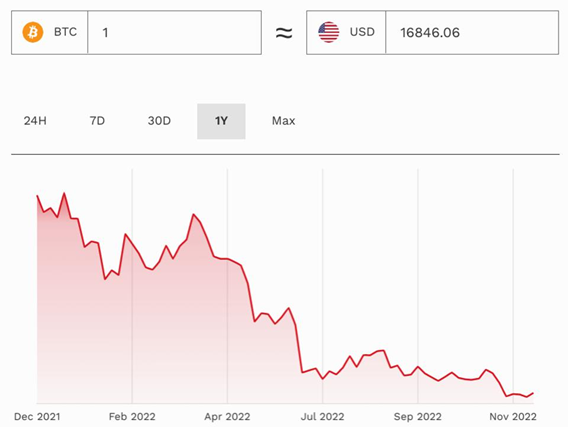
Bitcoin’s price has been hit by stock market collapses and regulation, causing about 2 billion cryptocurrency capitalization to disappear.
Even so, there are still remnants that this vast speculative wave is still alive.
At the January rally, it was not strange that the stocks and assets that rose the most were precisely those that had fallen the most, among which, the meme shares, those held by ARK funds and cryptocurrencies.
This shows the resilience of investors in general to economic deterioration, and hinders the work of the FED.
The use and abuse of IPO and SPACs was another manifestation of the euphoria of the markets.
In conclusion, 2022 was globally bad for investments, but assets that performed better than others.
There was a common pattern to this differentiated behavior.
The sectors, styles and market segments that fell the most were, roughly speaking, those that had risen the most in previous years.
This sets us the tone for the next article in which we developed the theme of adjusting valuations of various assets to current market conditions.


