We consider it important to do so because we are living and witnessing a change of regime or paradigm, to a situation that is new and that many are unaware of.
In the initial article we made the introduction and presentation of the approach to the theme.
This article focuses on what happened in 2022, but framing it in a more comprehensive perspective of development, performance and economic cycles and financial markets.
2022: Losses of 20% in major equities and bonds indexes
2022 was a difficult year, with sharp losses in both equity markets and bond markets, as we saw in the recent Quarterly Outlook:
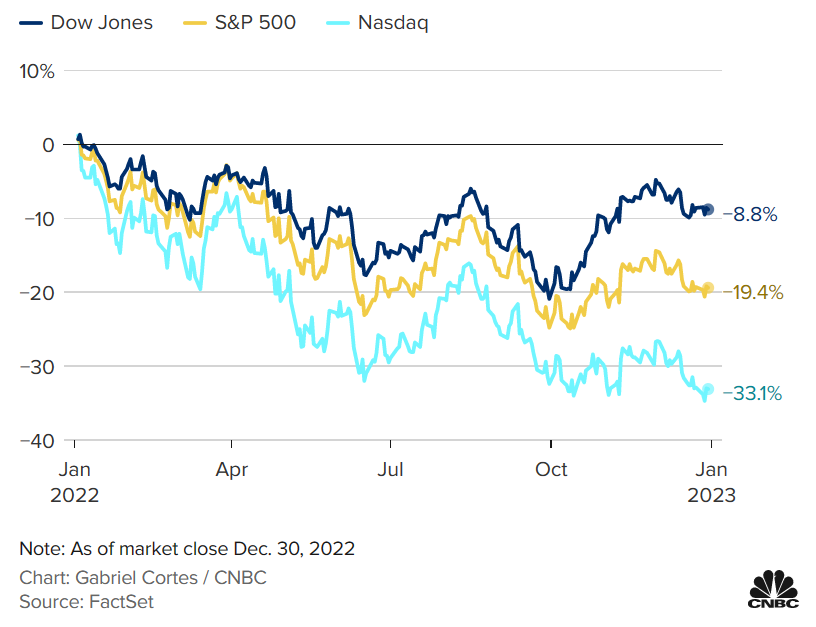
The main equity market index, the U.S. S&P 500, lost 19.3 percent, the biggest annual loss since 2008, halfway to the other two benchmarks in that country.
The tech Nasdaq 100 lost 33.1%, and the Dow Jones IA lost 8.8%.
U.S. bonds were no better either.
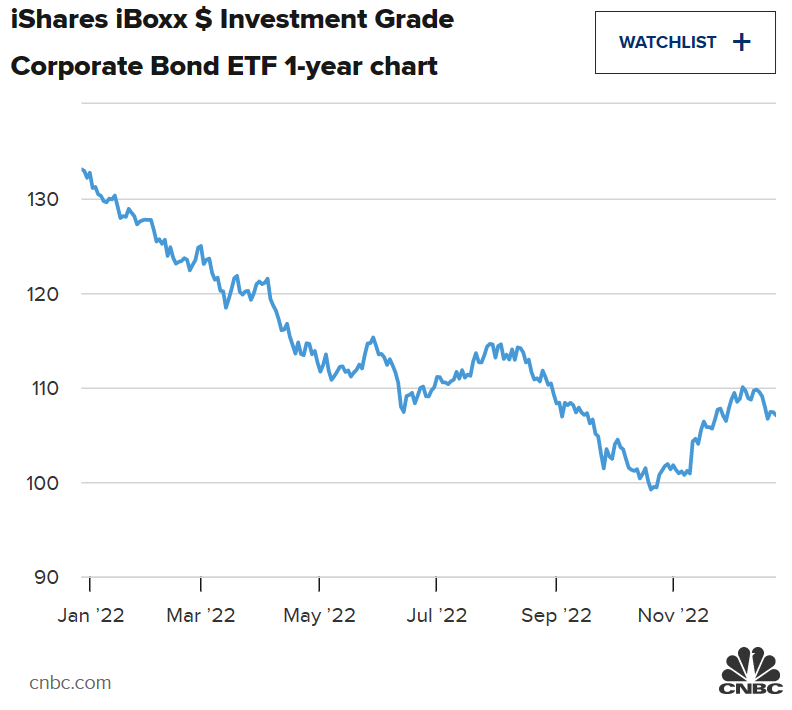
One of the major U.S. bond indexes, iShares iBoxx Investment Grade Corporate Bond lost nearly 20 percent, the biggest loss in its history.
In the Rest of the World, losses were also accentuated, both in stocks and in bonds.
For major European stock markets, the Eurostoxx 600 lost 12.8%, the DAX 30 12.5% and the CAC 9.5%. The FTSE 100 gained 1.2%, but the more domestic index, the FTSE 250, lost 19.5%.
Japan’s Nikkei lost 9% and China’s Hang Seng more than 15%.
On bonds, losses on investment in treasuries ranged from around 18% in the European Union, France and Germany, to 24.5% in the UK, 5.7% in Japan and 16.5% in emerging markets.
There was no escape from losses, or refuge in any asset, and the poor performance of bonds was unprecedent.
What cost the most this year 2022 were the simultaneous sharp losses in the two main assets, stocks and bonds.
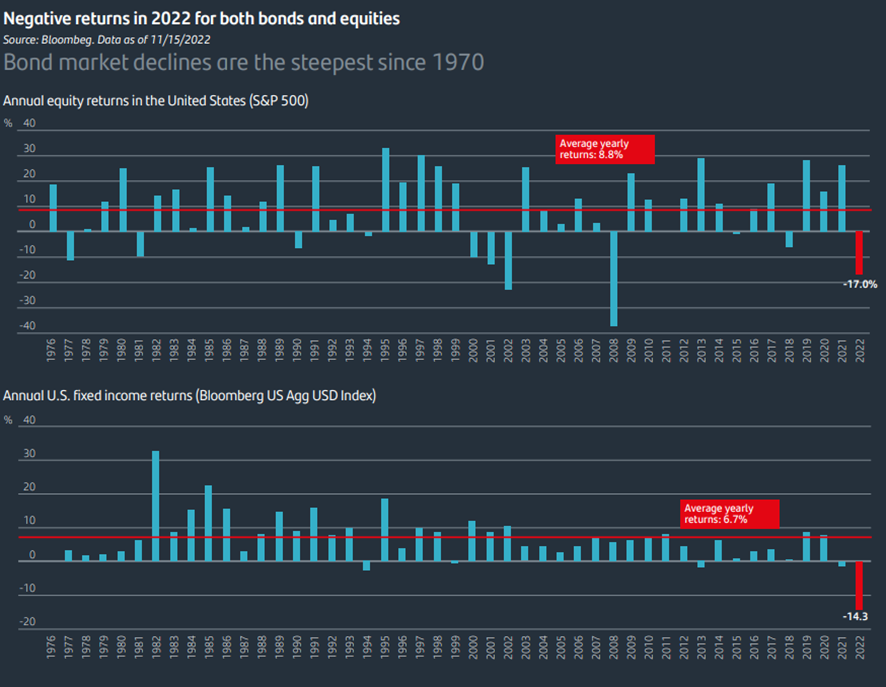
In the case of equities, corrections greater than 20% are infrequent, but happen from time to time.
However, in bonds the 14% correction in the Bloomberg US Aggregate index, equivalent to similar indexes, was the highest since 1970, and by a wide margin. This has put an end to the long bull market of bonds.
This concurrency of sharp losses in bonds and equities resulted that 2022 was one of the worst years for the traditional portfolio 60/40, only surpassed by 2008:
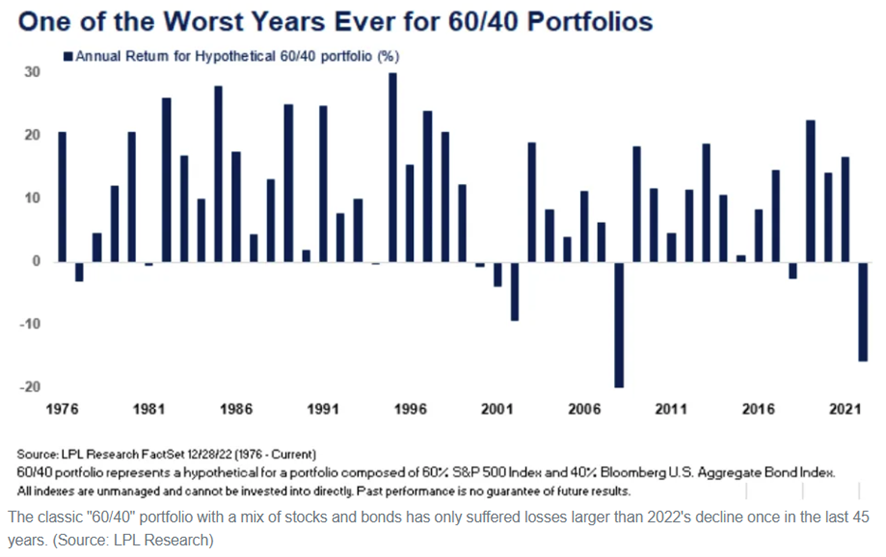
However, in 2008, the loss resulted from equities, and the bonds smoothed that fall.
This unexpected novelty is the main reason we feel the correction differently from previous years.
This statement can be made in a different sense, pointing out not to the fact, but to the underlying causes, which we mentioned earlier.
The surprise came from the shift in high stock market valuations and interest rates close to zerofor stock valuations and interest rate levels approaching the long-term historical average.
All this due to the fight against high inflation, which worsened with the war in Ukraine.
Why should we keep the value of investment perspective in financial markets?
#1 If we look at the last few years, investment performance remains very positive
The following table frames the returns on US stocks (S&P 500) and bonds (10-year treasury bonds) in 2022 from a medium, long, and very long-term perspective, with a history of more than 97 years:
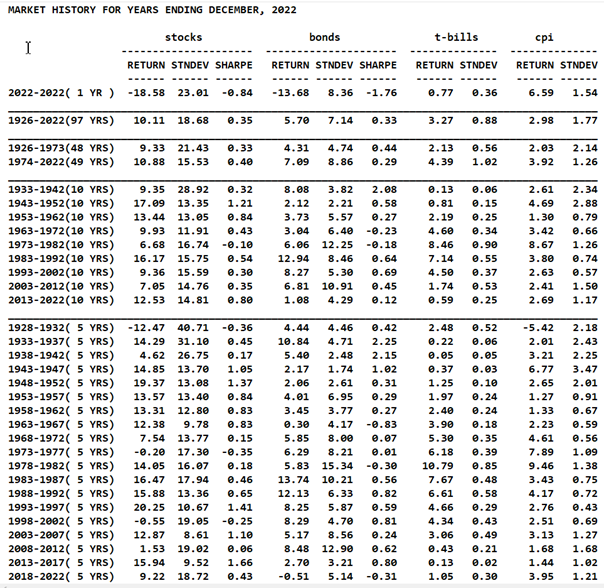
Between 2019 and 2021 we had supranormal returns in investing in stocks, and medium in bonds.
Over the past 10 years, we have had returns well above the historical annual averages of 9.6% in the U.S. stock markets.
Bond returns have also been reasonable, and with low volatility, since the exit of the Great Financial Crisis just over a decade ago.
The following table, known as the periodic table of investment returns, shows the annual returns of the main assets over the past 10 years, as well as the annualized average returns of each:
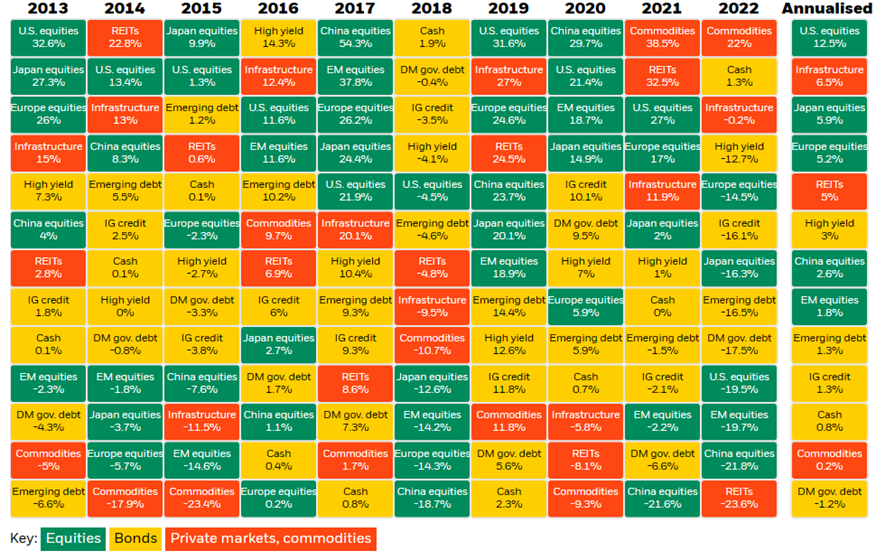
U.S. stocks rose 31.6 percent in 2019, 21.4 percent in 2020 and 27 percent in 2021.
The stocks returns in many of the other years of this decade were also very interesting, making the average annual returns 12.5%, including the 19.7% devaluation in 2022.
European stocks performed worse, with an average annual returns of 5.2% in that decade.
In recent times, the valuations of these stocks were quite high, from 24.6% in 2019, 5.9% in 2020 and 17% in 2021, until the loss of 14.5% in 2022.
In these 10 years, the bond investment returns were moderate.
The average annual returns on U.S. investment quality rating bonds was 1.9% and that of speculative grade bonds (“high yield”) was 3%.
Losses in 2022 were 16.1% in the first and 12.7% in the second, resulting from rising interest rates and increased credit spreads.
#2 Recent market corrections have considerably improved forecasts for medium- and long-term returns
“Whether we’re talking about socks or stocks, I like buying quality merchandise when it is marked down.”, Warren Buffett
Financial market corrections have considerably improved the returns prospects in the future.
The multiple valuation of the stock markets, namely the PER ratio (quotient between price and company earnings), fell in all geographies:
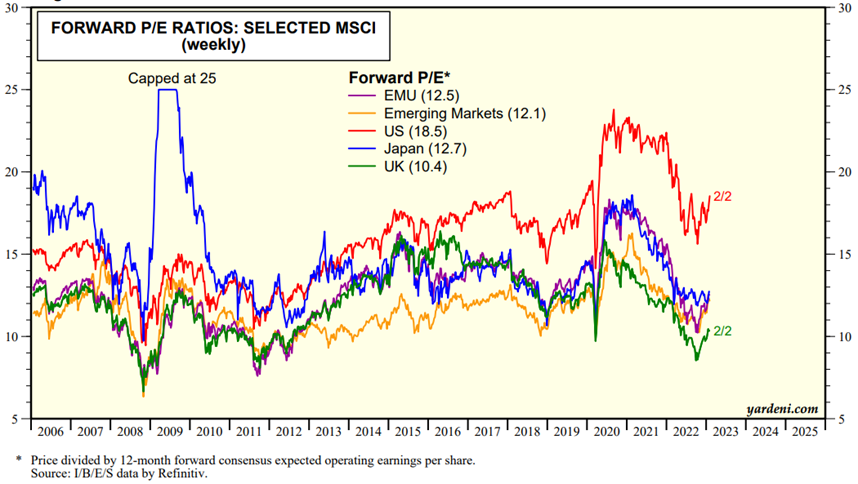
As a result, there has been an increase in forecasts of return on investments in the long-term stock markets.
At the end of each year studies are published by investment banks and asset managers for these forecasts, which consider the macroeconomic context and the main market valuation variables.
The recently published JP Morgan study, for example, concludes that long-term returns forecasts (annual averages for a 10-15 year horizon) have never been higher in the last decade:
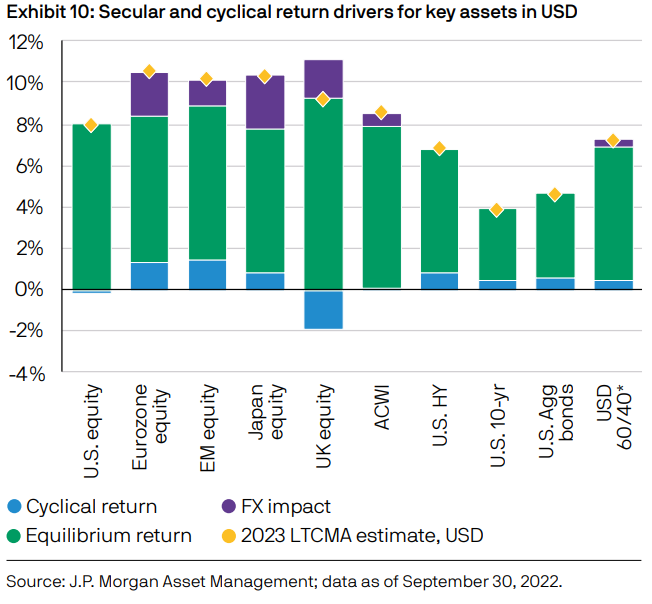
It estimates that the forecast for annual returns for the traditional 60/40 portfolio, consisting of a US portfolio of 60% stock and 40% bonds over the next 10-15 years rises from 4.30% last year to 7.20%.
In the last 25 years, the 10-year return to this portfolio was 6.10%.
According to this study, the efficient frontier of assets that shows the relationship between expected long-term ret and risk for all major assets has evolved as follows:
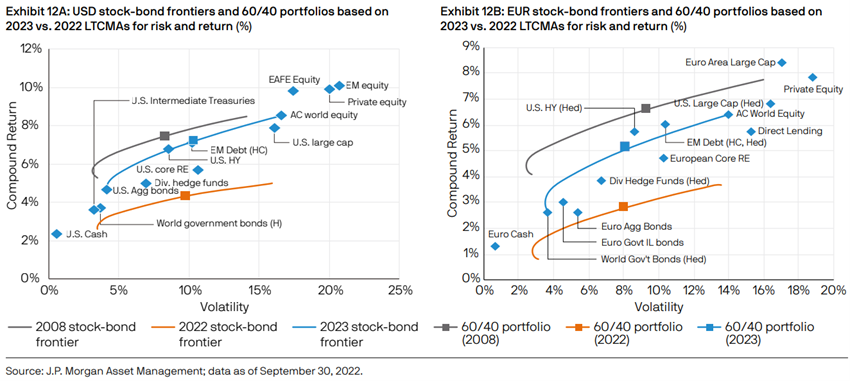
Between 2021 and 2022, the border moved significantly upwards, with increased returns for the same level of risk as all assets, i.e. an improvement in the attractiveness of their investments.
The current efficient border is the most favorable in the last decade, being just below the border of the end of the financial crisis.
In other words, the attractiveness of long-term investments was only more favourable in 2008.
Markets are much more attractive than a year ago, and if the fragility of cyclicality extends in early 2023, which is very likely, returns may still get a little more interesting thereafter.
#3 Corrections don’t always last and are quickly recovered
We know that market corrections, even the least frequent and sharpest, do not always last, as is apparent from the following table showing the bull and bear cycles of stock markets since 1926:
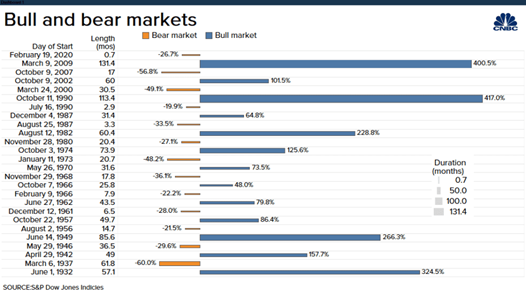
Excluding extremes, it is observed that most bear market have average corrections of 30%, and durations of 20 months (just over 1.5 years), and markets bull shows average valuations of 70% within 60 months (5 years).
#4 History repeats itself, and the past shows that these losses are normal and compensated
The average annual returns on long-term financial investments are high, providing good valuations of capital invested with moderate risk:
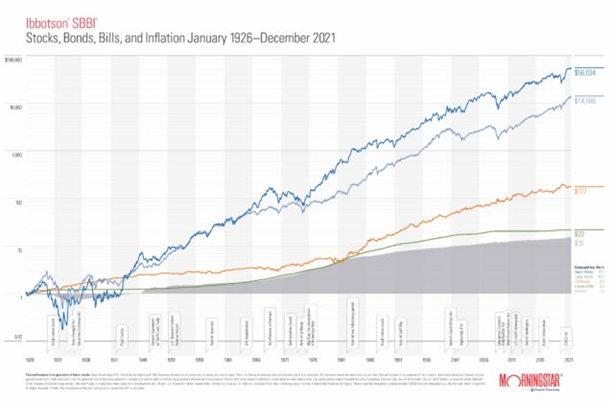
Since 1926, average annual returns on the stock market (S&P 500) have been 9.6% per year and 10-year U.S. treasury bonds have been 5.1% per year, with an average annual inflation rate of 2.9%.


