


Advanced economic indicators are more useful for investments than official statistical indicators
Advanced macroeconomic indicators give useful indications about the movements of financial markets, but the cause-and-effect relationship is questionable
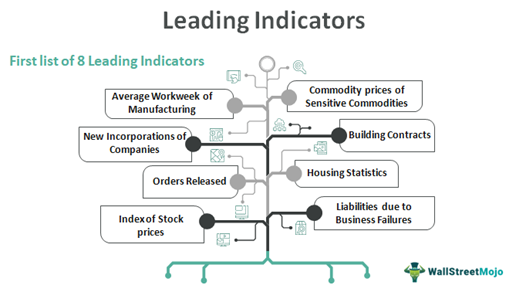
The various types or categories of advanced economic indicators
Financial markets live on predictions or anticipations of the future.
Investment returns depend on future performance, dividends, interest and capital gains from asset price valuations.
These components are influenced not only by the specific situation of the undertaking concerned, but also by the macroeconomic context.
Stocks perform best at a time of good levels of economic growth and/or low interest rates.
Bonds benefit from lower forward interest rates and robust economic growth.
To this extent, analysts and professional investors follow very closely a number of indicators that they consider important for projecting the performance of markets in the future.
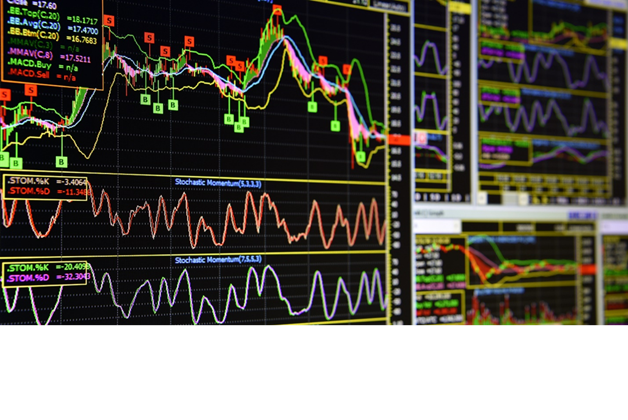
There are basically two categories of indicators, economic or fundamental on the one hand, and technical, quantitative or statistical, on the other.
As the names themselves indicate the former are used in the methods of fundamental analysis and valuation and the latter in the models of the technical analysis of the markets
In this article we develop the economic indicators, which seek to measure economic activity.
In a subsequent article, we will develop the technical indicators, of a statistical nature, linked to asset prices, such as moving averages, supports and resistances, extension, depth, etc.
Advanced economic indicators are more useful for investments than official statistical indicators
The main economic indicators naturally focus on economic growth, or on GDP as a whole, or on its components, whether on consumption performance, since it is the largest component of GDP, representing more than 60%, or on exports and imports, and on the evolution of interest rates and inflation.
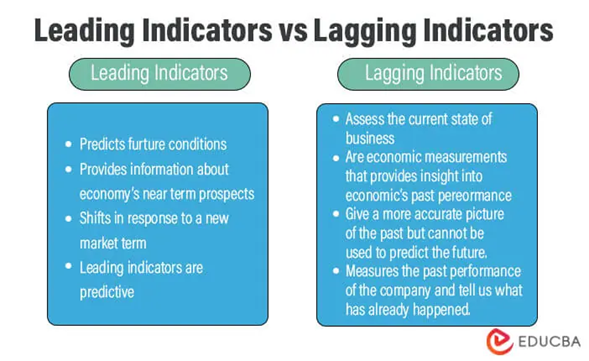
However, the most commonly used macroeconomic indicators, such as GDP, production, domestic consumption and exports and imports, are of very little use because official statistics are released with a large lag from the date of their measurement (usually of a month or more).
To that extent, these indicators are looking like looking in the rearview mirror and seeing the past, not the future.
That is why experts follow another type of macroeconomic indicators that claim to capture the reality of those macroeconomic variables, but at the present time.
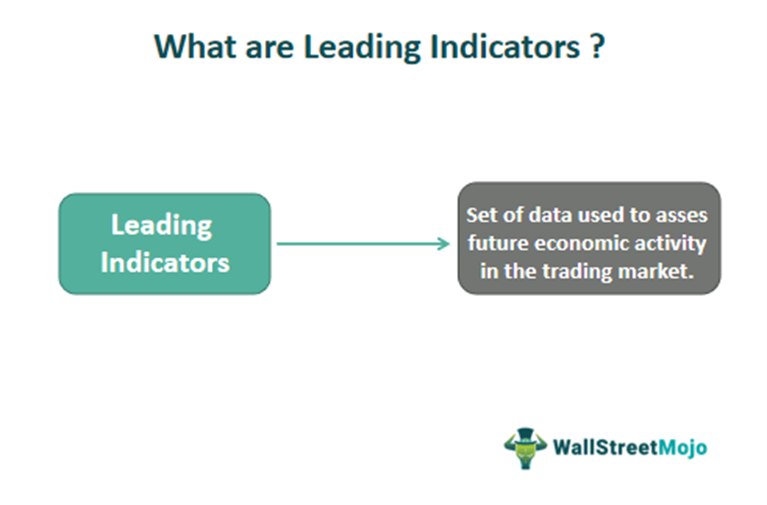
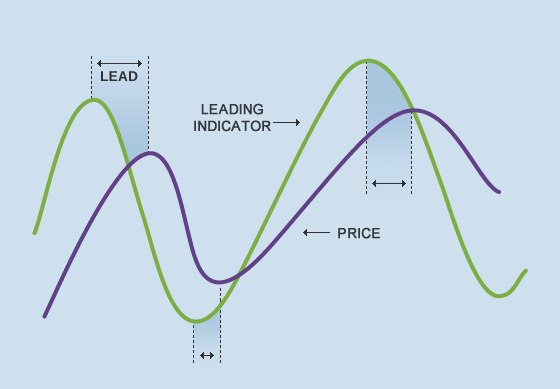
These indicators are called leading or advanced indicators. They are also known as sentiment indicators because in most cases they result from surveys of economic agents, whether producers or consumers.
There are several categories of indicators according to the reality they intend to capture.
Measures of economic activity are highlighted, including production, consumption and exports and imports.
Employment data are also very important in that they highlight the situation of businesses and have an impact on households, affecting their disposable income and consumption, and thereby economic activity.
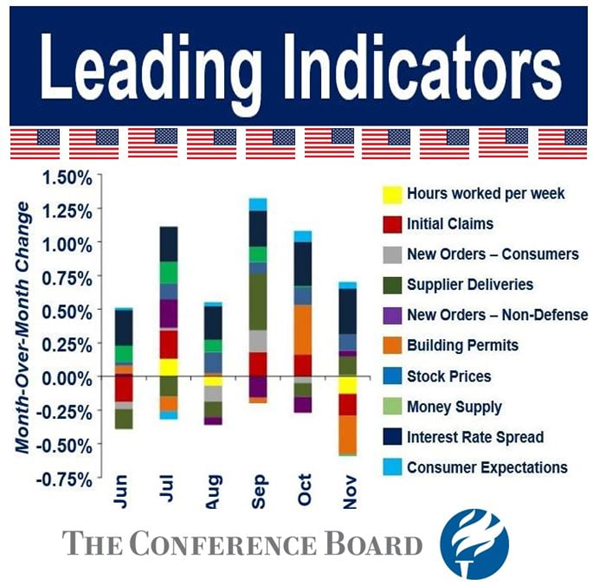
There are direct indicators, or those that seek to measure a certain macroeconomic variable, and other indirect indicators, which are signals for measuring it. The evolution of retail sales or maritime freight transport is a good example of indirect indicators.
Leading macroeconomic indicators give useful indications about the movements of financial markets, but the cause-and-effect relationship is questionable
Before we develop this theme, it is worth making the following observation.
Although these economic indicators are called leading, because they anticipate or leave good indications about future economic developments, they are not advanced for the financial markets.
In other words, there is no cause-and-effect correlation between these indicators and the performance of the markets.
In fact, this correlation even exists, but in the opposite direction. Some studies point to the fact that stock market indices, in this case the S&P 500, are a good predictor of economic developments.
Others show that long-term interest rates are also a good predictor of economic activity.
This reality is not surprising in that markets live on expectations and anticipations about future developments, so this relationship shows that markets are quite efficient in forming these forecasts.
The following two charts show the behavior of the S&P 500 index and two of the most widely used advanced indicators, the PMI (Purchasing Manager Index) for the U.S., respectively, for the manufacturing and services sector that are released at the beginning of each month.
In the first chart, we have the evolution of the S&P 500 index and the average of the PMIs of industry and services:
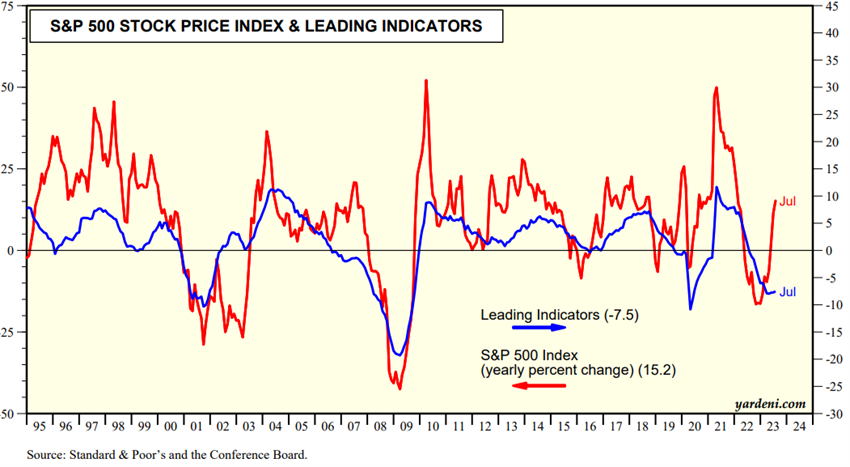
This chart seems to indicate that the cause-and-effect relationship is from the S&P 500 to the PMIs, with a lag of between 6 and 12 months.
In the second chart we have the evolution of the S&P 500 index and the PMI of the industry:
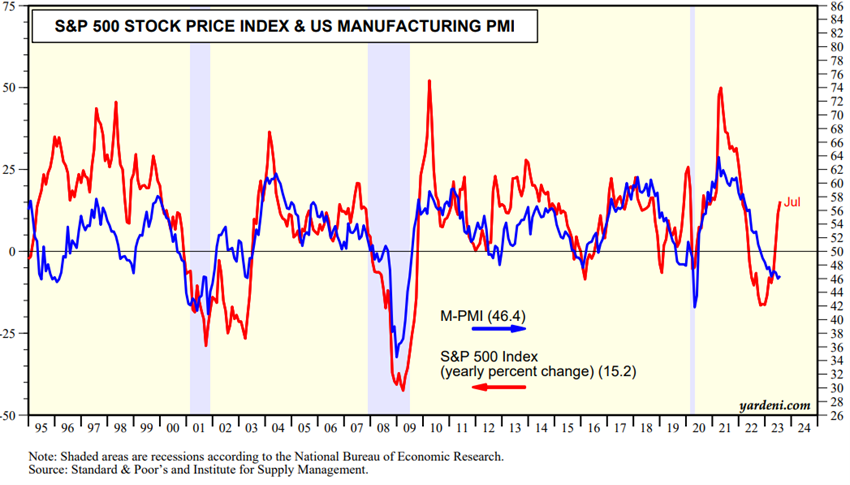
This graph indicates a more perfect relationship than the previous one, which may seem strange.
In fact, in the U.S. (and most developed countries), services account for more than 67 percent of GDP and industry less than 15 percent.
However, the situation of industry is more relative, profound and lasting than that of services.
In this link we have a series of updated charts at each moment of the relationships between these PMIs and a number of important variables of the stock markets, including sales growth, earnings per share growth, past and future, etc.:
https://www.yardeni.com/pub/pmisp500.pdf
We consider it worth going through some of these charts to better understand the relationships between this indicator and the market variables.
For example, the relationship between PMIs and company results is strong and quite simultaneous.
The relationship between PMIs and sales growth is also evident, albeit more outdated.
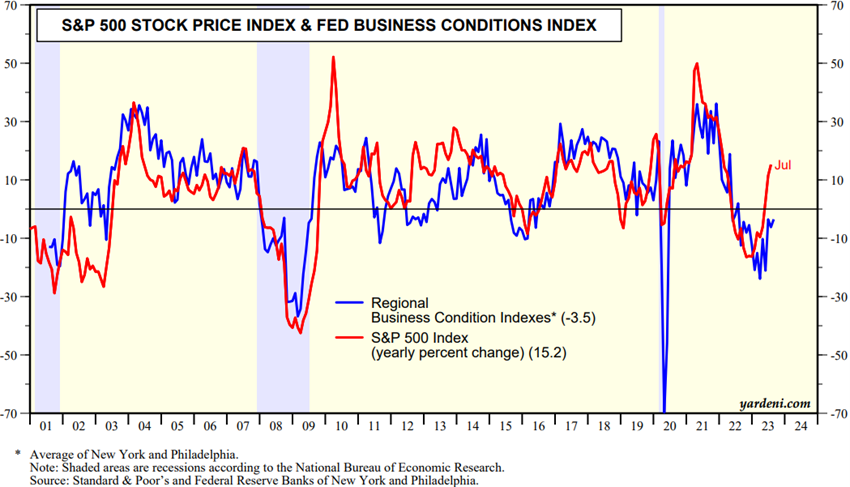
The following are two other charts that we consider important, those of the S&P 500 index and the Fed Business Conditions indicator, and the industry PMI and the spread between 10-year interest rates and official Fed interest rates.
These two charts intend to further anticipate in time and consolidate, the information contained in the advanced indicators.
The relationship between the S&P 500 and the Fed’s central bank index is narrow, direct and intense, almost perfect.
This means that the Fed can be a good predictor of the S&P 500:
The relationship between interest rates and the industry PMI is also very important:
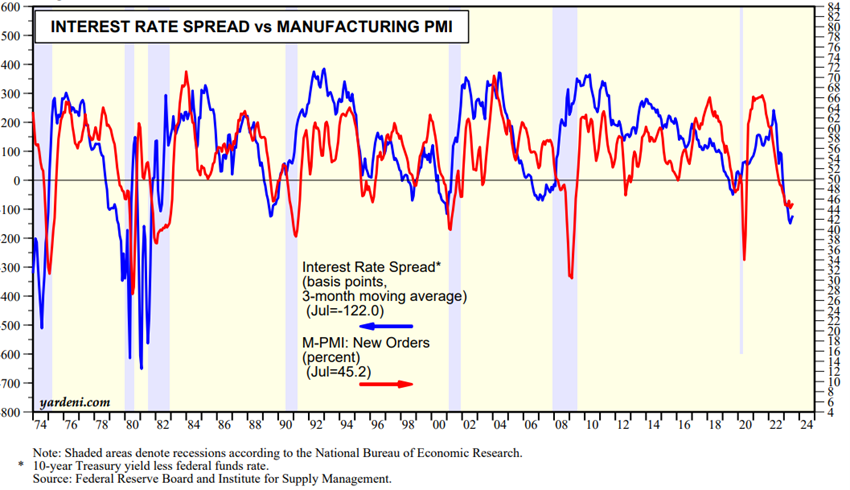
Generally speaking, the level of this interest rate spread is seen as a predictor of recessions.
When this spread is negative, there is usually a recession after 6 to 18 months. This has happened in all the recessions marked in shade.
https://www.yardeni.com/pub/pmisp500.pdf
https://learn.bybit.com/indicators/best-technical-indicators/
The various types or categories of advanced economic indicators
There are indicators of various types and for various countries, regions or even for the whole world, with different periodicities.
It cannot be overstated that the dominance of the US is overwhelming in this set of indicators, as it is in much of the information in the financial markets.
There are the growth indicators, the most important being the monthly PMIs by countries and for the world, and the monthly ISM, and the monthly Philadelphia for the US.
There are confidence indicators, including Michigan Consumer Confidence and Business Confidence for the U.S., Zew for Germany/Europe, and OECD for all OECD countries, all monthly.
There are employment indicators, including weekly Jobless Claims and monthly ADP reports in the U.S.
There are also indicators of the activity and profitability of companies, such as EPS, profit margins, retail sales and weekly durable goods orders, for the US.
There are also indicators of interest rate developments, the main one being the yield curve.
There are also global indicators such as the monthly Baltic Dry Index that seeks to measure international shipping activity in order to assess the intensity of foreign trade.
Each of these key financial market indicators will be developed in a specific article published in the Tools folder, including:
Purchasing Managers Index (PMI)
Institute of Supply Management index (ISM)
Michigan Consumer Confidence, Business Confidence
Durable orders


