Return on Invested Capital (ROIC) as the key metric in fundamental valuation and Gordon’s model
ROIC in the evaluation of companies
ROIC and cost of capital determine value creation
The relationship between earnings growth rate and cash flows
ROIC is the measure most used by analysts of leading institutional investors around the world
This article is part of a series on investing in stocks.
In the first article we presented the reasons for investing in individual stocks.
We have also seen how we can use a core and satellite strategy in managing our wealth, combining market-indexed and low-cost investments with investments in individual stocks.
In the second we addressed the topic of how we can select the universe of stocks to arrive at our list of stocks to invest in.
We have linked the purpose of this list to the lists of stocks that have performed excellently in the past.
We have also seen that although there are many lists made publicly available by the specialized media there is only one list that suits our individual case.
Then we move on to the principles of analysis and evaluation of the actions that will be part of our list.
In a later article, we analysed the importance of investing in stocks with lasting or sustainable competitive advantages and what are the analysis methodologies to identify them.
But as important as the value of these companies with competitive advantages is the purchase price.
In the most recent article we covered the various valuation methods – fundamental, technical and quantitative analysis – in order to conclude whether a stock is at a reasonable and fair price or too expensive.
Within the scope of fundamental analysis, we have seen the discounted cash flow models and their simplified version, the Gordon model, as being the most sensible way to determine the value of a business.
In this article, still on fundamental analysis, we want to draw attention to the importance of ROIC – the Return On Invested Capital – in the model and determination of a company’s profit that is available to be distributed to shareholders.
We will also see the relationship of ROIC with other financial variables of the model, the growth and the distribution of results.
We highlight ROIC as the key metric of the fundamental value of the stock, and analyze its relationship with the various previous models.
Basically, there are three factors that determine the stock price, ROIC, growth, and cost of capital (return required by shareholders).
Return on Invested Capital (ROIC) as the key metric in fundamental valuation and Gordon’s model
“The higher the return that a business can yield to its capital, the more money it can produce, and the more value is created. As time goes on, it is difficult for investors to achieve returns that are much higher than the return on invested capital of the underlying business.” Warren Buffett
“The best business to invest in is one that over a long period of time can employ large amounts of incremental capital at very high rates of return.” Warren Buffett
Return on invested capital (ROIC) measures the profit generated for every dollar invested in the company.
It is the true measure of the profitability in cash flows of the capital invested in the company.
As such, it is the main driving force of stock prices.
The formula for calculating ROIC is simple:
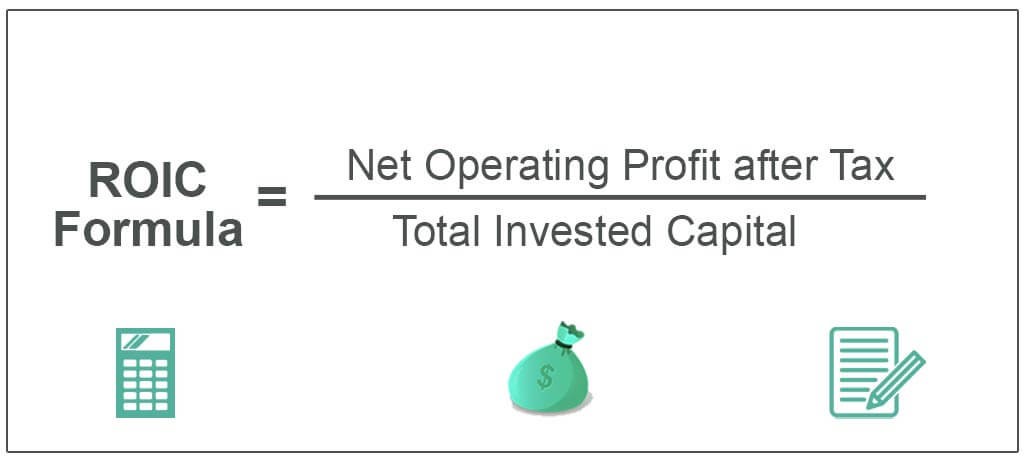
ROIC is the quotient between the net operating result (after taxes) and the total capital invested in the company, that is, the NOPAT/Invested Capital, or the NOPAT/Revenues x Revenues/Invested Capital.
ROIC in the evaluation of companies
ROIC is linked to the valuation of companies through economic profit, a measure of residual outcome.
It is called “residual” because it is the result after all costs have been taken into account, including the cost of capital.
Economic profit can be calculated in two different ways:
Economic profit = (ROIC – WACC) x Invested capital = NOPAT – (Invested capital x WACC)
This profit is also known as Economic Value Added (EVA)
The important point is that a discounted cash flow model based on free cash flows or economic profit results in the same value if the various inputs are the same and the terms are defined correctly.
ROIC and cost of capital determine value creation
ROIC gives a sense of the ability of using capital to generate profits for a company.
Comparing a company’s ROIC to its weighted average cost of capital (WACC) reveals whether the invested capital is being used effectively.
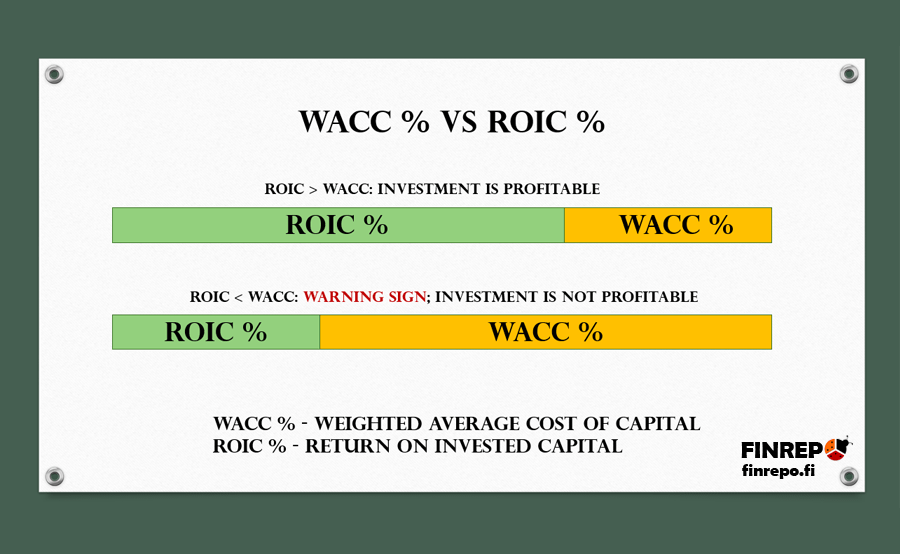
The explanation is very simple.
Basically, if the return on investments exceeds the cost of capital, there is value creation, and the more you invest, the more wealth you create. On the contrary, if the return is lower than the cost of capital, money is lost and the more you invest, the greater the loss.
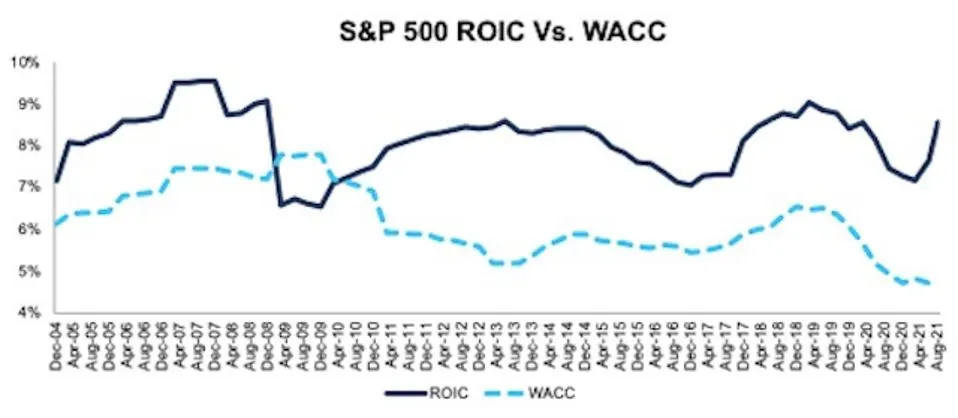
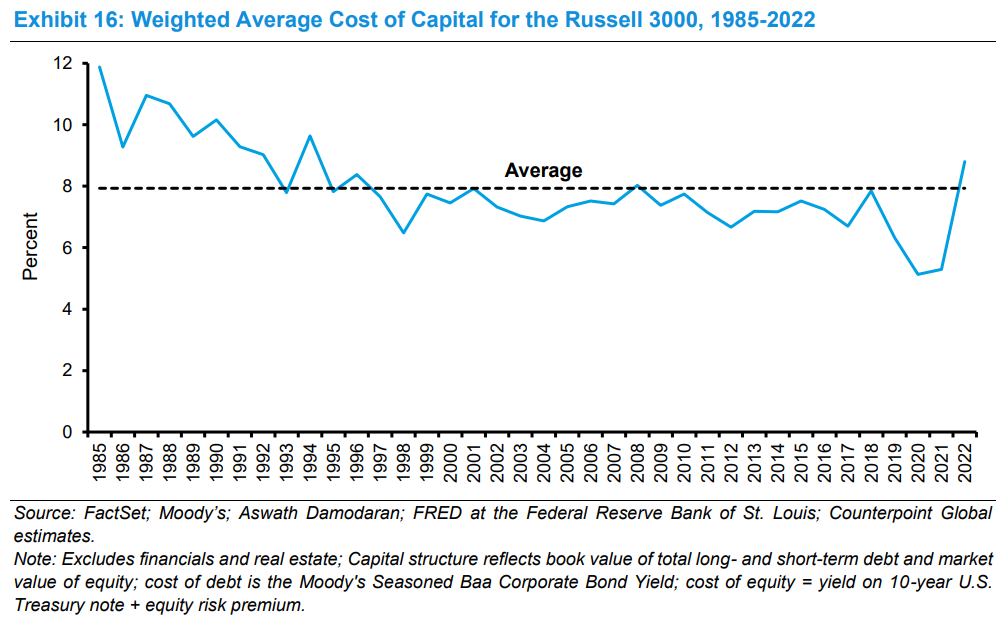
The ROIC ranged from 6.5% to 10%, almost always exceeding the weighted average cost of capital from 5% to 7%.
The profit margin was between 10% and 14% and the capital turnover was 0.6 to 0.8x.
Over the past 40 years, the average cost of capital has been 8%, falling in a range of between 6% and 12%.
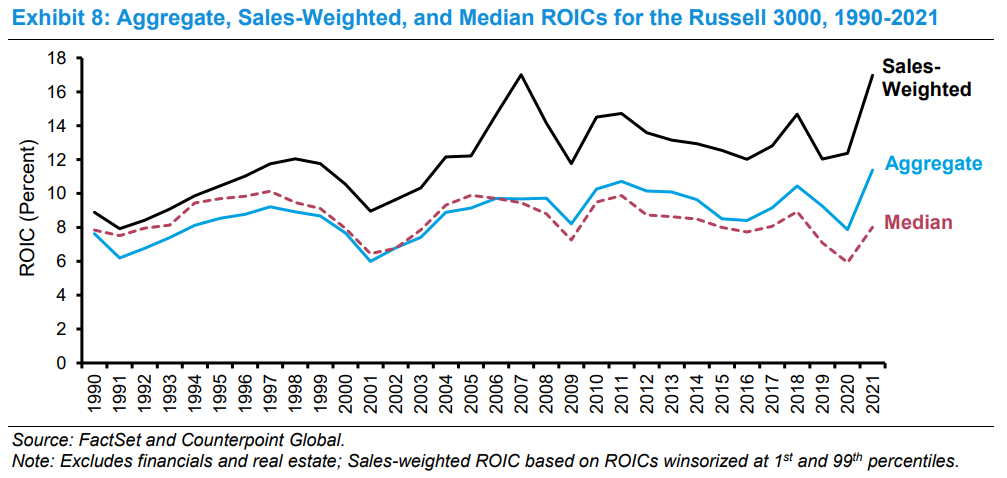
The following charts show the ROIC and cost of capital for the Russell 3000 companies between 1990 and 2021:
The relationship between ROIC, reinvestment rate, growth rate, and dividends
There is a relationship between return on invested capital (ROIC), reinvestment rate (RI), growth rate (g) and results (E):
g = IR x ROIC
D = (1 – IR) x E
Intuitively, the company’s growth rate (g) depends on the reinvestment rate (RI) and the returns it can generate from that investment (ROIC).
The first expression tells us that companies with a high ROIC can achieve the same growth rate (g) as low ROIC companies with a lower reinvestment rate (RI).
Similarly, the results that a company has available to distribute to its shareholders depend on this reinvestment rate (RI).
The second expression tells us that if two companies produce the same results (E), the company with a higher ROIC has more cash available to distribute dividends (D).
In Gordon’s model of fundamental valuation that we have seen in previous articles, the influence of ROIC on valuation is positively felt both in the denominator (as it is usually referred to) and in the numerator (less mentioned):
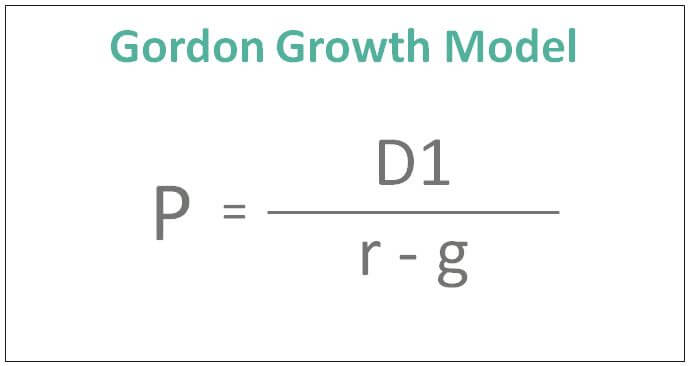
For one, the higher the ROIC, the higher the growth g, the lower the denominator, and the higher the share price.
On the other hand, the higher the ROIC, the lower the IR reinvestment rate, the higher the D dividends, the higher the numerator, and also the higher the share price.
In this way, the effect of ROIC is amplified.
In short, a company with a higher ROIC than another and everything else equal, grows at a higher rate, and can also reinvest less and distribute more dividends to shareholders.
The relationship between earnings growth rate and cash flows
Dividends (D) and earnings growth rate (g) are not independent of each other.
There is always a trade-off between the positive effect on price (P) from a higher g (which turns the denominator, r – g, into a smaller number) and the negative effect on price (P) that arises because that same higher level of g requires a smaller D in the numerator.
The more you want to grow (g), the greater the reinvestment (IR), but the greater the reinvestment, the lower the free cash flows for distribution to shareholders (D).
ROIC is the measure most used by analysts of leading institutional investors around the world
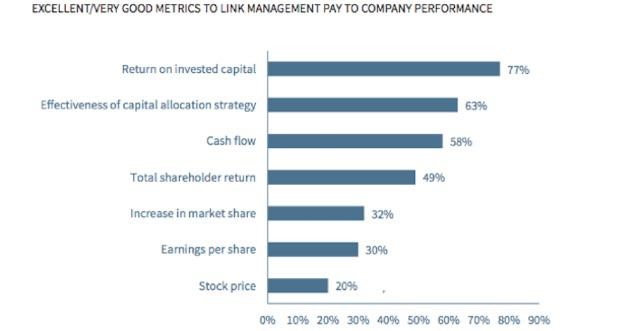
ROIC is the measure most used by institutional investors in evaluating companies:
A recent study by Ernst & Young showed that ROIC explains about 57% of the value of companies in the S&P 500:
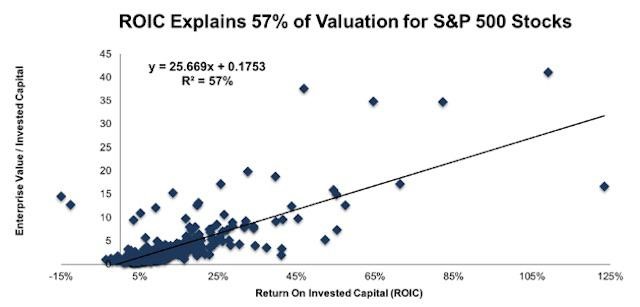
It is important to note that other metrics, such as EPS, return on equity, and EBITDA, have much weaker links with the valuation of companies.
Thus, companies that encourage their managers to pursue these metrics are not doing the most straightforward work to align management with the interests of shareholders.
Companies that focus on ROIC thrive in all markets, but especially outperform bear markets.
Momentum can boost unprofitable companies in a bull market, but when the market starts to fall, cash flows are the fundamental.
In addition, the emphasis on ROIC prevents over-investment in low-return projects that destroy long-term shareholder value.


