In the previous articles of this series we have seen the description, the main characteristics and advantages of investing in mutual funds, as well as the main types of funds and the importance of their investment policy.
The main categories or types of funds are the first factor in the choice of mutual funds, due to the investor suitability.
Then comes the question of the funds profitability.
In this article, we will address the various issues of the returns of mutual funds, knowing that they are generally an essential factor in deciding the choice of funds.
We will focus on the average returns of the different categories, the dispersion of returns within each category, the consistency of returns in time, the risk-adjusted returns, and the impact of returns in the valuation of invested capital.
This series is accompanied by the publication of articles containing information on the main mutual funds of each category in the Best of Mutual Funds Series in the Wealth and Investments folder and a summary sheet of the information of the funds in the Tools folder.
We know that choosing a fund with a good profitability track record is one of the principles of selecting mutual funds.
Individual and institutional advisors, distributors and mutual fund investors rely heavily on past returns to formulate their investment recommendations or decisions in the funds.
There are studies that show funds with higher past returns attract more capital. However, it is important to note that we must look at these returns with some caution.
In fact, as we will also see in this article, most studies also show that the consistency of returns on mutual funds is low, i.e. the best performing funds in a given period, be it 3, 5 or 10 years, are unable to maintain this higher performance in subsequent periods.
Hence the mandatory regulatory warning to investors of “past returns does not mean future returns”.
The average returns obtained by individual investors are lower than those of the main market indices of these assets
According to one of the most recent annual Quantitative Analysis of Investors Behaviour studies by Dalbar, which analyzes the average returns obtained by individual U.S. investors in equity and bond investments for periods of 1 to 20 years, the results were as follows:
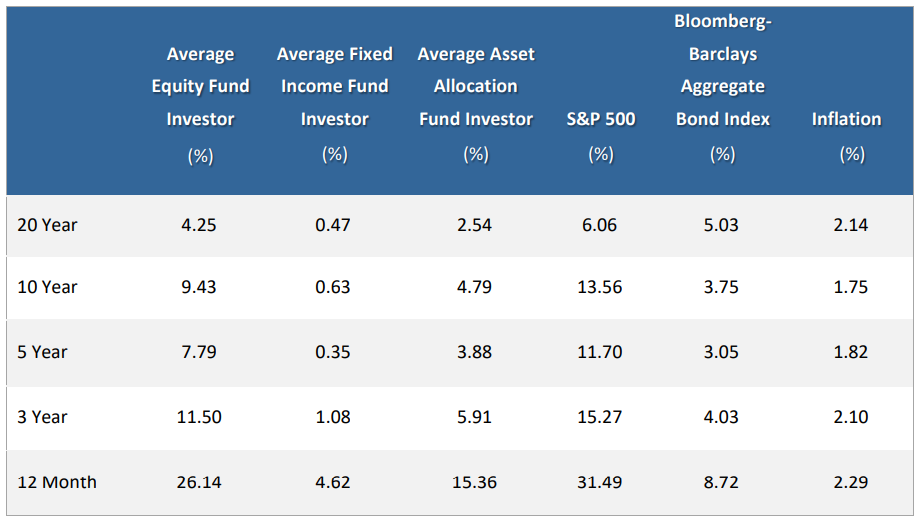
Source: Quantitative Analysis Investor Behaviour, Dalbar, 2020
Average annual returns on equity investments made by investors have been 9.43% over the past 10 years, compared with the average return on the S&P 500 index of 13.56% in the same period.
If we extend the deadline to the last 20 years, the average annual return on equity investments was 4.25% versus the average annual returns of that 5.03% index.
In the case of bond investments, the average return on investors over the past 10 years is 0.63% versus the 3.75% of the benchmark market index, the Bloomberg-Barclays Aggregate Bond Index, in that period.
For the 20-year period, average annual yields were 0.47% for investors, against 5.03% of the market index.
Finally, investors with an average asset allocation had average annual returns of 4.79% and 2.54% over the last 10 and 20 years, respectively, with the inflation rate of 1.75% and 2.14%, respectively, in the same periods.
It is concluded that the average returns of investments on both equities and bonds made by long-term investors is lower than that provided by market indices (the same is the case in the shorter periods). Which means they’d be better off investing directly in investment products on these indices.
It is also concluded that the average return of investors, with an average asset allocation, is low and slightly higher than the inflation rate. This is due to the fact that the average allocation has a significant weight of bonds compared to stocks.
When we decide the mutual funds in which we are going to invest it is important to keep in mind the average past returns of mutual funds.
As we saw earlier, there are several types of funds, with different performance and “benchmarks”, so we can not compare all together.
It is therefore important to know and evaluate the average returns of the various categories of funds.
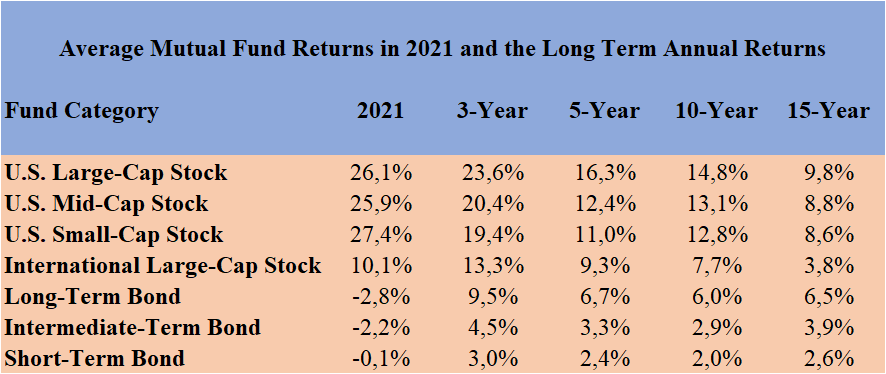
According to Morningstar data, the average annual returns of mutual funds in the U.S. market from 1 year to 15 years, grouped into their main categories, were as follows:
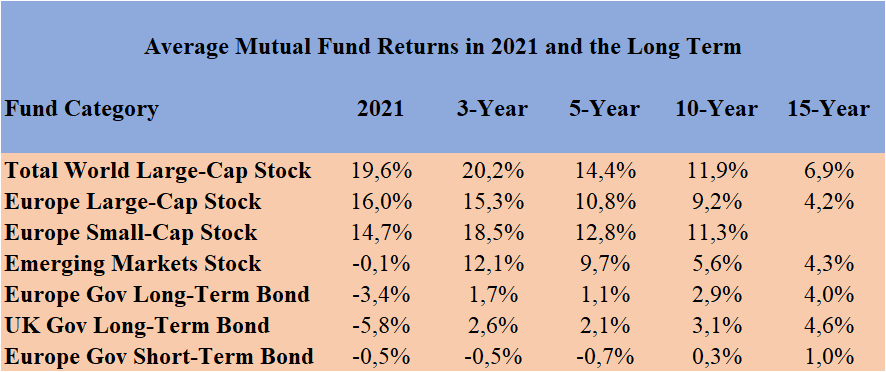
Also according to Morningstar data, the average returns of mutual funds in global stocks and bonds in Europe, Japan and emerging markets in the most recent periods from 1 to 15 years were as follows:
There is a large dispersion of returns between the funds of the same categories, which is greater the less efficient is the market of the underlying asset
There is a large dispersion between the returns of the funds, even those belonging to the same category.
That is why it is worth analysing how the returns of the funds of the category we want for the various quartiles is distributed, and most importantly, to know in which quartile or position in the profitability ranking, the funds we analyze are.
Also based on Morningstar data we analyzed the dispersion of profitability of the universe of funds under cover.
We have evaluated the returns of funds by categories available in the last 10 years by positioning the returns obtained by the best and worst fund, as well as the minimum returns of the 1st, 2nd (median) and 3rd quartile:
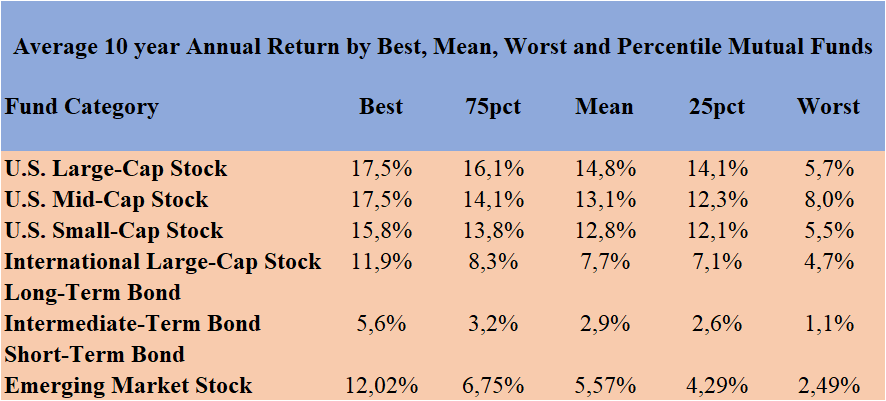
This table proves the wide dispersion of returns between funds of the same category and stresses the importance of making a good selection of funds.
The point is not just to avoid the worst funds.
Returns differences of 2% to 3% per year that seem small have a major impact on the long-term accumulation of capital, as we will see below.
In another article we will show that the funds with the best returns are usually the ones with the lowest costs.
The time consistency of fund returns is low, i.e. it is very difficult to maintain a fund’s superior performance over time
In addition, it is also important to look at the consistency of performance over time, i.e. to look at the extent to which mutual funds with better returns in a given period are able to maintain that performance over time in following periods.
There are several studies showing that contrary to what was thought, the time consistency of returns on investment funds is low, i.e. that funds that perform better relatively in certain periods then go through periods with worse relative performance.
Moreover, it is this reality that justifies the warning that “past returns do not mean future returns”, since it is also known that most investors are attracted or try to follow the highest returns.
Choi and Zhao recently revisited Carhart’s 1997 study that concluded that U.S. investment funds with better returns in a given year achieve better gross returns the following year, significantly.
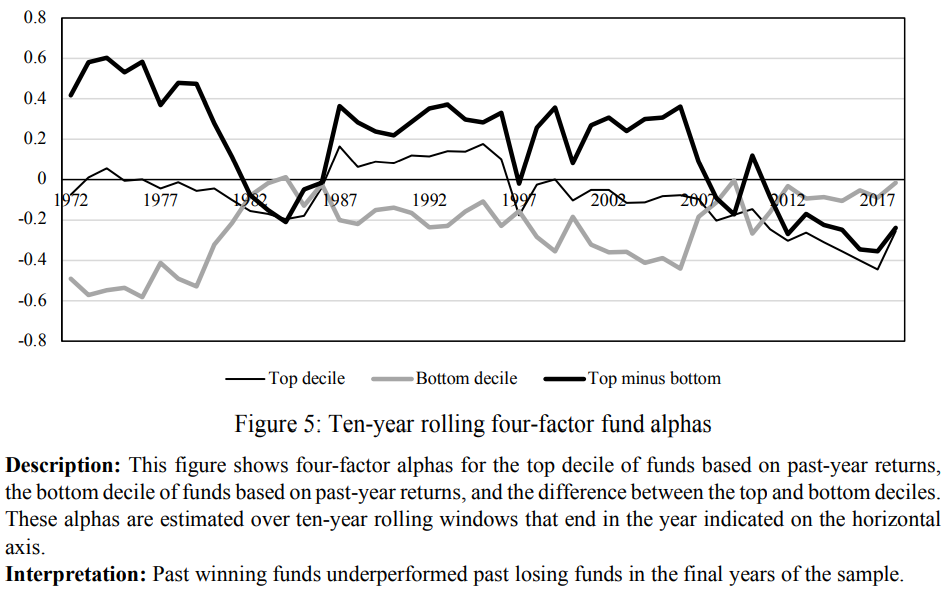
They found that during the period 1962-1993, mutual funds whose last year profitabilty was in the top 10% produced significantly higher returns in the following year than funds whose return last year was at the worst 10%.
But they then discovered that this effect was greater in the period 1962-1980, and that it had been mitigated in the following years. For the years 1994-2018, they found that there was no statistically significant future return difference between the best and worst performing mutual funds in a given year.
There have also been three recent studies conducted separately by Morningstar, S&P Dow Jones and Mobikwik that evaluated the results of quartile returns.
The results differ slightly if we look at how many funds remained only in the first quartile, but such a rigorous test may not be a significant measure of the fund’s performance. This is because only a small minority of funds remain in the first quartile for successive periods. It is unrealistic that a bottom is always at the top, but ideally it should be above average (remain in the first two quartiles).
Morningstar’s study with data between 2013 and 2019 reached the following results:
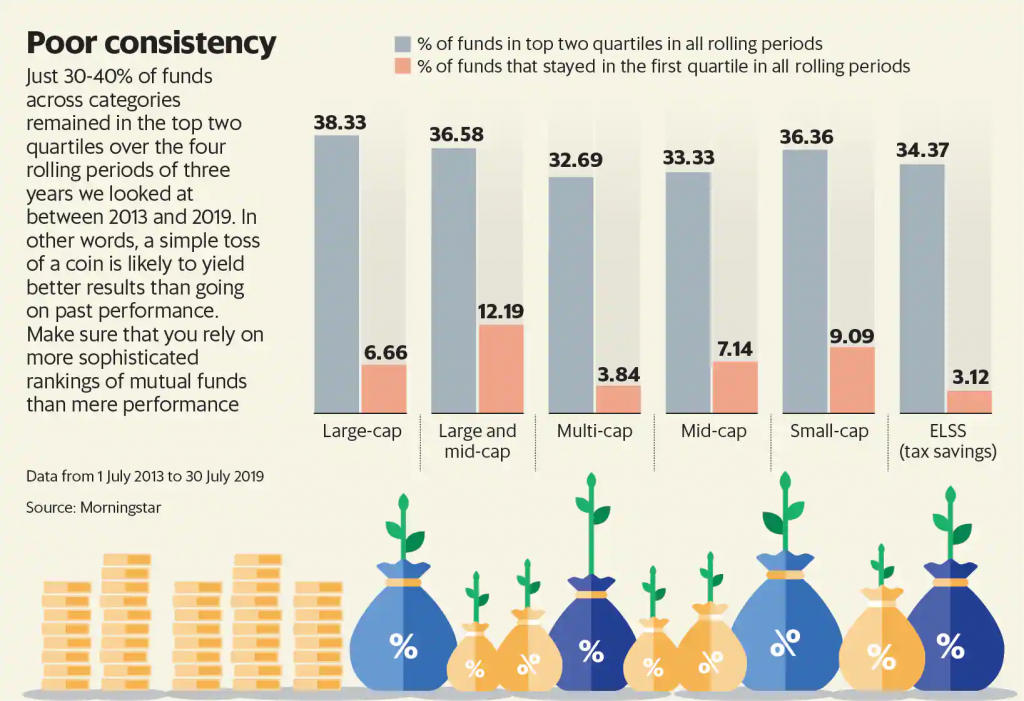
Only 30% to 40% of the funds in the various categories remained in the first 2 quartiles over the 4 rolling periods of 3 years between 2013 and 2019, which is worse than sending a coin into the air. And those who remained in the first quartile were less than 3.1% to 12.2%.
There is a difference or gap between the returns disclosed by the funds and those obtained by investors arising from the time of the investment
While it may seem like a detail, as we are talking about returns it is important to know that, strictly speaking, investors do not get the returns disclosed by the funds.
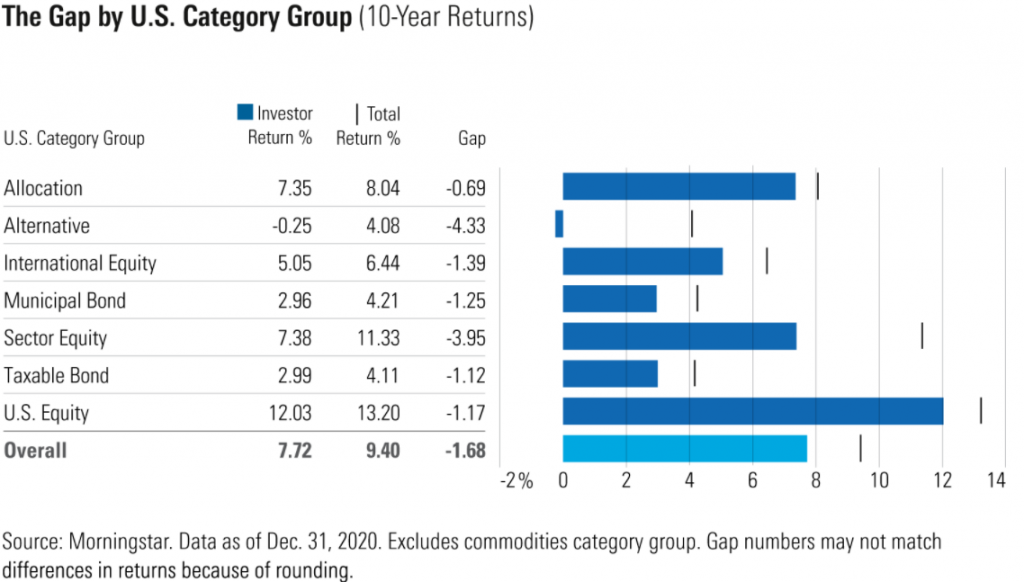
The fact that investors buy the funds with the best past returns means that they do not have the returns of that fund. This gap is precisely the result of investors buying the funds after they have recorded good returns.
According to a recent Morningstar study, the gap presented by the various categories of U.S. funds was as follows:
Risk-adjusted returns is the most appropriate measure for assessing the comparative performance of funds, with the Sharpe ratio as the most relevant indicator
Returns are one of the important factors in deciding the choice of funds. Risk is another important factor.
It is obvious that funds of different categories have different degrees of risk. Bond funds have a lower risk than stocks, and money market funds have an even lower risk. As we have seen, these lower risk levels correspond to lower returns.
However, of course, funds of the same category have different degrees of risk, since the composition of their investment portfolio can be quite different, either because their diversification is diverse or even because the securities chosen have different volatilities.
For example, we know that starting a stock fund with only 10 to 20 securities will have higher risk than another in the same category with 60 to 80 securities. We also know, for example, that value stocks have lower volatility than growth stocks, and that in general, stocks of smaller companies have higher volatility than large ones, so funds with different compositions in these dimensions naturally have different risks.
The Sharpe ratio is a measure disclosed by funds that seeks to measure risk-adjusted profitability.
This ratio is calculated as the quotient between the difference in the return on risk-free profitability and the standard deviation as a measure of volatility, thereby measuring excess profitability per unit of risk. So the higher the heat of the Sharpe ratio the better.
Thus, where possible the investor should also compare the Sharpe ratio between the funds of the same category that he or she thinks of buying because the difference in profitability may result from a higher risk.
For example, the Vanguard 500 Index Investor VFINX fund displays the following relative Sharpe ratio:
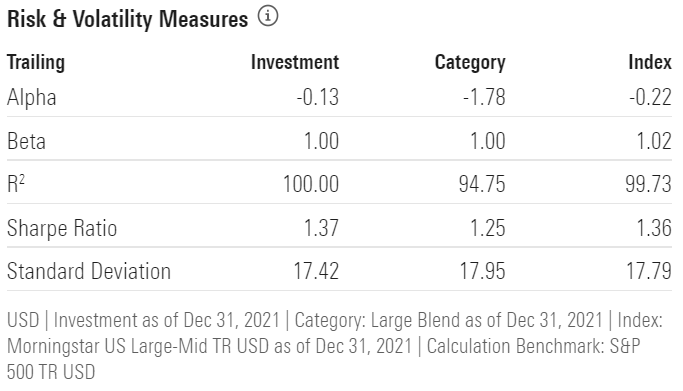
The Sharpe ratio of the fund is 1.37, better than that of 1.25 in the category.
Profitability is very important because different rates of return on funds, even apparently small ones, have a major impact on the valuation of capital invested in the medium long term
The returns of mutual funds are a very important factor considering the effect that different returns have on the valuation of capital invested in the medium and long term due to the compouding effect:
The differences between the lowest and highest rates are abyssal, but they should not surprise us.
However, as we said earlier, small differences in rates of return result in large differences in accumulated capital over very long periods.
If we don’t let’s look at a very illustrative example. Investing with a rate of return of 12% per year compared to a rate of 10% results in a capital of more than 40% after 20 years and after 40 years it is twice as much
In a subsequent article we will see the relationship between the net return of the funds (which are the ones that matter to investors) and the costs of those funds.


