This article is part of a series on simple portfolios, which are portfolios that can be made up of few assets and investments, in some cases only two.
In the first article we gave a general presentation of the series and explained why these simple portfolios are very interesting for individual investors.
These portfolios, although very simple, contain the essential elements of returns, risk, diversification and allocation, for a good performance in the medium and long term.
In the first part of this second article we covered the characteristics of the traditional 60/40 portfolio, who it is intended for and its historical performance, showing why it is the portfolio most used by individual investors for life.
Now we will see what its advantages and limitations are and how we can easily build our 60/40 portfolio with the available investment products.
What are the advantages and limitations of the traditional 60/40 portfolio?
How can we build the 60/40 portfolio?
The estimate of medium and long-term returns for the traditional 60/40 portfolio
What are the advantages and limitations of the traditional 60/40 portfolio?
The main advantage is the combination of solid returns with less volatility, as we saw earlier, which has been ideal for many investors of all ages, including retirees.
The traditional portfolio of 60% stocks and 40% bonds is intended to address the dual objectives of long-term capital appreciation and capital preservation.
And these balanced portfolios have performed well over the years.
When compared to a 100% portfolio in equities, the 60/40 portfolio stands out for its excellent growth and moderate volatility.
That’s not to say it’s not volatile, but its swings are significantly smaller than the 100% stock portfolio.
Since 1972, a portfolio of 60/40 has had an average annual rate of return of 9.61%.
These returns are less than a 100% stock portfolio, which generated 10.75% over the same period.
However, what is remarkable, is the volatility.
The standard deviation of a 60/40 portfolio was only 9.51%, while the stock portfolio stood at 15.25%.
For these differences in outlook, the worst year for a 100% equity portfolio during this period was -37.5%, versus only -16.9% for the 60/40 portfolio.
At the same time, the worst devaluation for the stock-only portfolio was almost -51%, against -28% for the 60/40 portfolio.
However, some critics have begun to question the popularity of this basic approach to investing with the series of market crises of the 2000s, along with historically low interest rates.
It is recalled that in the so-called “lost” decade of 2000, the 60/40 portfolio generated a weak annual return of 2.3% and investors would have lost value if we adjusted for inflation.
More recently, arguments have been presented that stem from the unprecedented financial times we are currently living in and that are as follows.
Firstly, the cycle of falling interest rates and very positive bond rates of the last 40 years is over, as we analyzed in an article.
Second, stock market valuations are still very high and there is a large concentration on mega capitalizations, as we have been analyzing in the last quarterly outlooks.
Third, the negative correlation of the past 30 years between stocks and bonds is showing signs that it may be ending.
Finally, each of these factors is compounded by current high inflation, as we saw in another article.
Some of these critics use the sharp devaluations of this portfolio’s nearly 20% portfolio this year to support their argument.
What these critics consider is that it is no longer possible to rely solely on stocks and bonds for income, growth, protection against inflation and preservation.
Therefore, they argue that a well-diversified portfolio should include more asset classes than just stocks and bonds.
Critics believe that for the investment portfolio to be adequately diversified it will have to contain alternative investments such as real estate, infrastructure, private equity, venture capital, hedge funds, precious metals, commodities and collectibles.
One of the most frequently cited examples has been Yale University’s foundation fund management policy.
Our opinion is different.
While we consider that more diversification is preferable to less, we understand that this portfolio of just two assets has served investors so well for almost 100 years and will continue to do so, as we saw earlier.
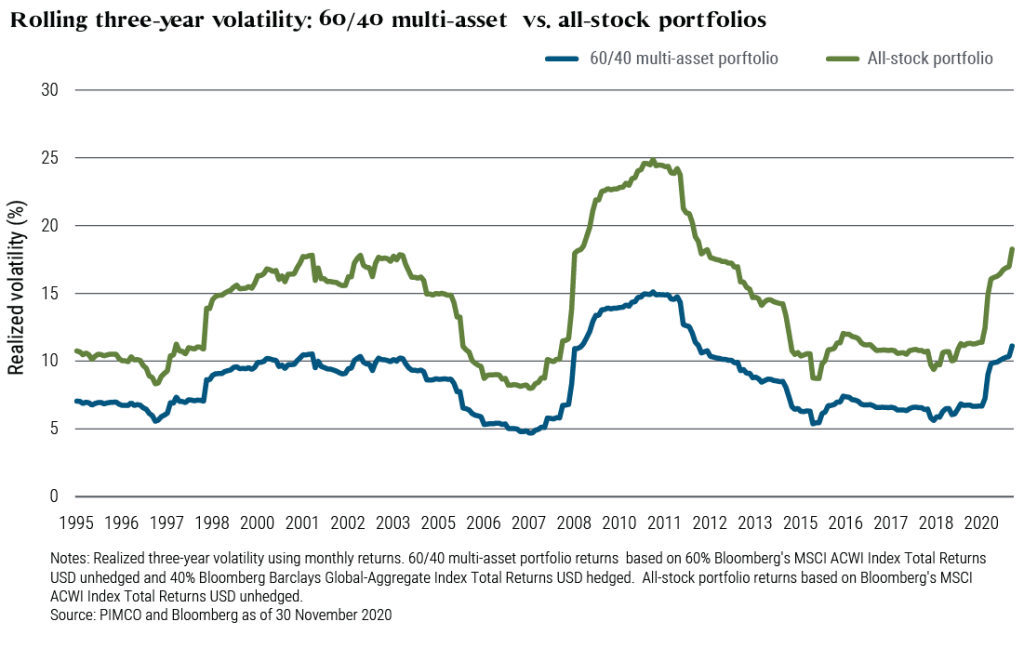
Not only is the portfolio’s high profitability impressive, but above all its low relative volatility:

The average volatility of the three-year 60/40 portfolio is less than 10%, while that of the 100% equity portfolio is above 15%, or minus a third.
And profitability is not too far off.
https://blog.pimco.com/en/2020/12/the-60-40-portfolio-is-alive-and-well
We consider that the traditional 60/40 portfolio remains very valid and interesting, and perhaps the portfolio of two assets, or only two investments, is more attractive.
Its simplicity of understanding, execution and management and the ease of implementation for any investor are unique.
On the other hand, in opposition to the theme of poor performance this year, the ongoing adjustment process has pushed risk-free interest rates to levels of 4%, close to the historical average, and stock market valuations are also already approaching the historical average, with the S&P PER falling from 24x to 18x (16x average).
This suggests that it is likely that interesting returns from the past may be observed in the future.
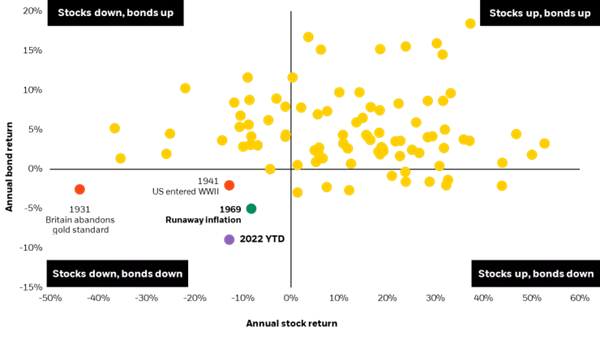
The current situation of negative returns on stocks and bonds is abnormal and extraordinary:

Apart from this year, it has only occurred so sharply with the rampant inflation of 1969, the entry of the US into the 2nd WW in 1941 and the abandonment of the gold standard by Britain in 1931.
Generally speaking, both assets have good annual returns, and when this does not happen the good performance of one of them compensates for the worse performance of the other.
In these terms, instead of abandoning the 60/40 allocation (or other combinations of weights that we will see in other articles), investors can use it as the nuclear or core portfolio in a core/satellite portfolio construction.
Satellites would be investments in the remaining asset classes.
We believe that this issue of diversification by alternative investments makes more sense for very high value assets.
For example, for affluent or wealthy families (the “High Net Worth Individuals” or HNWI, with assets exceeding 1 million dollars, and especially the Ultra High Net Worth Individuals” or UHNWI, with assets exceeding 30 million dollars).
The selection of these investments is much more demanding in terms of knowledge and experience, and access to the best funds and management companies may be limited to higher capital.
These more fortunate households can use the services of financial advisors who are very specialized in the selection of these satellite investments and have the financial capacity to access the best investments of this category.
How can we build the 60/40 portfolio?
The construction of this portfolio is very easy, being one of its main advantages.
The equity component of the portfolio should be made in a single stock investment fund that is very diversified and representative of the global market, either the world market, or the U.S. market as the largest stock market in the world, and in dollars.
The bond component of the portfolio should be carried out in a single highly diversified bond fund representative of the investment quality rating bond market (equal to or greater than BBB-) of the investor’s currency, and in that same currency.
With just two investments, we built our traditional 60/40 portfolio.
If the investor is U.S., the fund must be U.S. investment grade and dollar bonds.
If you are from the Eurozone, the bonds must be in euros, of the same rating, and if you are English in bonds in pounds sterling with the same rating.
In other articles, which are part of the Best of Investment Funds Series, we address some of the funds of the largest management companies in the world, larger in each of these categories, with low costs and with good absolute and relative returns.
Equity funds for U.S. investors comprise passive or index-linked funds and larger active funds.
Bond funds for these U.S. investors also include passive funds and the largest active funds .
Equity funds for investors outside the U.S. can be passive or index-linked funds and larger active funds.
Bond funds for these non-U.S. investors also include passive funds and larger active funds .
In the following links we can simulate the returns of the portfolio with various compositions of investment funds:
https://www.portfoliovisualizer.com/backtest-asset-class-allocation
The estimate of medium and long-term profitability for the traditional 60/40 portfolio
We disagree with the critical voices that have come to consider that the traditional 60/40 portfolio has lost usefulness, and even more so with the extremist claims of some who regard it as dead.
On the contrary, we believe that the portfolio will continue to provide a good combination of profitability and risk, while remaining the most suitable portfolio for most households.
Recently JP Morgan Asset Management (JPM AM) and Vanguard published two documents that validate our opinion.
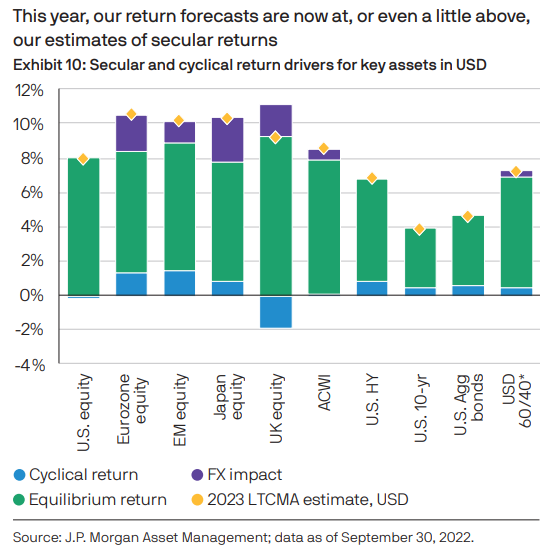
JP Morgan AM recently published its forecasts of yields on key assets over the medium and long term (10 to 15 years), concluding as follows:

JPM AM considers that the turbulence of 2022 has brought asset return forecasts close to equilibrium over the long term.
It therefore concludes that 60/40 can, once again, form the basis for portfolios, with alternatives that offer alpha, inflation protection and diversification.
That is, once the current market turmoil is overcome, investors will have more leeway to achieve the portfolio’s long-term return goals.
Vanguard is a bit more conservative, estimating that the 60/40 portfolio will provide annualized returns over the medium and long term of between 5% and 6%, when considering expected returns of 4.7%-6.7% on equities and 4.1%-5.1% on investment grade rating bonds.
Vanguard also recalls that the average annual profitability verified between 1926 and 2021 was 8.8% and that the loss of 12% in 2022 means that the average of the last 4 years was 7%, as the profitability between 2019 and 2021 was 14.3%.


