• About us
    • Who we are
    • Mission
  • Contacts
  • English
    • Português (Portuguese (Portugal))
    • Español (Spanish)
    • Français (French)
  • Login
  • Register
Investorpolis
Advertisement
  • Home
  • Investing Series Guide
    • All
    • I. Goal Based Investing
    • II. Compounding & Inflation
    • III. Assets Risks & Returns
    • IV. Efficient Diversification
    • IX. Sustainable Investing and ESG
    • V. The Investor
    • VI. Assets and Investments
    • VII. Index Funds
    • VIII. Successful Investing
    • XI. Other Topics
    Choosing Mutual Funds Series: Part 7 – The Largest Fund Management Companies

    Choosing Mutual Funds Series: Part 7 – The Largest Fund Management Companies

    Maximizing the time invested in the stock market instead of choosing the times to invest: Part 3 – The market cycles and the mean reversion

    Maximizing the time invested in the stock market instead of choosing the times to invest: Part 3 – The market cycles and the mean reversion

    Choose P4 Mutual funds series – Evaluate and use the benchmarks and ratings of funds

    Choose P4 Mutual funds series – Evaluate and use the benchmarks and ratings of funds

    Simple Portfolios (DIY) Series Part 3: The traditional 60/40 Portfolio, the pros and cons, and how to execute it

    Simple Portfolios (DIY) Series Part 3: The traditional 60/40 Portfolio, the pros and cons, and how to execute it

    Investing in Secular Stocks Series: Part 4.1 – The 3 Valuation Methods and Fundamental Analysis

    Investing in Secular Stocks Series: Part 4.1 – The 3 Valuation Methods and Fundamental Analysis

    Simple Portfolio Series (DIY) Part 2: The Traditional Portfolio 60/40, what it is, for whom, and its performance

    Simple Portfolio Series (DIY) Part 2: The Traditional Portfolio 60/40, what it is, for whom, and its performance

    Trending Tags

      • I. Goal Based Investing
      • II. Compounding & Inflation
      • III. Assets Risks & Returns
      • IV. Efficient Diversification
      • V. The Investor
      • VI. Assets and Investments
      • VIII. Successful Investing
      • IX. Sustainable Investing and ESG
      • X. Kits and Tips
      • XI. Other Topics
    • Wealth and Investing
      • All
      • Investing
      • Wealth
      Insurance Series: Part 2.1 – Life insurance: Description and characteristics

      Insurance Series: Part 2.1 – Life insurance: Description and characteristics

      Maximizing the time invested in the stock market instead of choosing the time to invest: Part 2.2 – Stock cycles and reversion to the mean

      Maximizing the time invested in the stock market instead of choosing the time to invest: Part 2.2 – Stock cycles and reversion to the mean

      Series How Women Invest: Part 3 – The 5 investment gaps and the retirement problem

      Series How Women Invest: Part 3 – The 5 investment gaps and the retirement problem

      2Q23 Financial Markets Outlook: Markets and the economy are at a crossroads, after some recovery, and risks from past excesses continue to emerge

      2Q23 Financial Markets Outlook: Markets and the economy are at a crossroads, after some recovery, and risks from past excesses continue to emerge

      The world’s best investors use different strategies, but they have in common the patience of a long-term perspective.

      The world’s best investors use different strategies, but they have in common the patience of a long-term perspective.

      The assets allocation in the world reflects the countries economic development and their financial system

      The assets allocation in the world reflects the countries economic development and their financial system

      Trending Tags

        • Investing
        • Wealth
      • Retirement & Savings
        • All
        • Retirement
        • Savings
        Retirement Series #3: Choice of asset allocation. Part 2 – The allocations preferred by experts and investors

        Retirement Series #3: Choice of asset allocation. Part 2 – The allocations preferred by experts and investors

        Retirement Series #3: Choice of asset allocation. Part 1 – The effect on accumulated capital

        Retirement Series #3: Choice of asset allocation. Part 1 – The effect on accumulated capital

        Retirement Series: How much money do we need to live through retirement?

        Retirement Series: How much money do we need to live through retirement?

        Retirement Series: Part 1 – Overview – A backwards view

        Retirement Series: Part 1 – Overview – A backwards view

        How many years do our public or social pensions last?

        What is the replacement rate of retirement pensions?

        Trending Tags

          • Retirement
          • Savings
        • Tools
          • All
          • Calculators
          • Publications
          • Sites and apps
          Morningstar Rating for Funds

          Morningstar Rating for Funds

          Morningstar’s European Active/Passive Barometer

          Morningstar’s European Active/Passive Barometer

          Morningstar’s U.S. Active vs. Passive Barometer

          Morningstar’s U.S. Active vs. Passive Barometer

          The Power of Dividends: Past, Present, and Future, Hartford Funds, 2021

          The Power of Dividends: Past, Present, and Future, Hartford Funds, 2021

          OECD Corporate Governance Factbook 2021

          OECD Corporate Governance Factbook 2021

          G20/OECD Principles of Corporate Governance, 2015

          G20/OECD Principles of Corporate Governance, 2015

          Trending Tags

          • calculators
          • Calculators
          • Publications
          • Sites and apps
        • More
          • All
          • Best of
          Best Of Mutual Funds Series: Dividend Stocks for Investors Outside the U.S.

          Best Of Mutual Funds Series: Dividend Stocks for Investors Outside the U.S.

          Best Of Mutual Funds Series: Dividend Stocks for U.S. Investors

          Best Of Mutual Funds Series: Dividend Stocks for U.S. Investors

          Best Of Mutual Funds Series: Investment Grade Bonds, Indexed, for Eurozone Investors

          Best Of Mutual Funds Series: Investment Grade Bonds, Indexed, for Eurozone Investors

          Best Of Mutual Funds Series: US Bonds, Indexed, for US Investors

          Best Of Mutual Funds Series: US Bonds, Indexed, for US Investors

          Best Of Mutual Funds Series: Passive, US Large Stocks, for Non-US Investors

          Best Of Mutual Funds Series: Passive, US Large Stocks, for Non-US Investors

          Best Of Mutual Funds Series: Passive Large US Stocks for US Investors

          Best Of Mutual Funds Series: Passive Large US Stocks for US Investors

          Trending Tags

            • Best of
            • Reviews
            • Snapshots
            • Others
          No Result
          View All Result
          • Home
          • Investing Series Guide
            • All
            • I. Goal Based Investing
            • II. Compounding & Inflation
            • III. Assets Risks & Returns
            • IV. Efficient Diversification
            • IX. Sustainable Investing and ESG
            • V. The Investor
            • VI. Assets and Investments
            • VII. Index Funds
            • VIII. Successful Investing
            • XI. Other Topics
            Choosing Mutual Funds Series: Part 7 – The Largest Fund Management Companies

            Choosing Mutual Funds Series: Part 7 – The Largest Fund Management Companies

            Maximizing the time invested in the stock market instead of choosing the times to invest: Part 3 – The market cycles and the mean reversion

            Maximizing the time invested in the stock market instead of choosing the times to invest: Part 3 – The market cycles and the mean reversion

            Choose P4 Mutual funds series – Evaluate and use the benchmarks and ratings of funds

            Choose P4 Mutual funds series – Evaluate and use the benchmarks and ratings of funds

            Simple Portfolios (DIY) Series Part 3: The traditional 60/40 Portfolio, the pros and cons, and how to execute it

            Simple Portfolios (DIY) Series Part 3: The traditional 60/40 Portfolio, the pros and cons, and how to execute it

            Investing in Secular Stocks Series: Part 4.1 – The 3 Valuation Methods and Fundamental Analysis

            Investing in Secular Stocks Series: Part 4.1 – The 3 Valuation Methods and Fundamental Analysis

            Simple Portfolio Series (DIY) Part 2: The Traditional Portfolio 60/40, what it is, for whom, and its performance

            Simple Portfolio Series (DIY) Part 2: The Traditional Portfolio 60/40, what it is, for whom, and its performance

            Trending Tags

              • I. Goal Based Investing
              • II. Compounding & Inflation
              • III. Assets Risks & Returns
              • IV. Efficient Diversification
              • V. The Investor
              • VI. Assets and Investments
              • VIII. Successful Investing
              • IX. Sustainable Investing and ESG
              • X. Kits and Tips
              • XI. Other Topics
            • Wealth and Investing
              • All
              • Investing
              • Wealth
              Insurance Series: Part 2.1 – Life insurance: Description and characteristics

              Insurance Series: Part 2.1 – Life insurance: Description and characteristics

              Maximizing the time invested in the stock market instead of choosing the time to invest: Part 2.2 – Stock cycles and reversion to the mean

              Maximizing the time invested in the stock market instead of choosing the time to invest: Part 2.2 – Stock cycles and reversion to the mean

              Series How Women Invest: Part 3 – The 5 investment gaps and the retirement problem

              Series How Women Invest: Part 3 – The 5 investment gaps and the retirement problem

              2Q23 Financial Markets Outlook: Markets and the economy are at a crossroads, after some recovery, and risks from past excesses continue to emerge

              2Q23 Financial Markets Outlook: Markets and the economy are at a crossroads, after some recovery, and risks from past excesses continue to emerge

              The world’s best investors use different strategies, but they have in common the patience of a long-term perspective.

              The world’s best investors use different strategies, but they have in common the patience of a long-term perspective.

              The assets allocation in the world reflects the countries economic development and their financial system

              The assets allocation in the world reflects the countries economic development and their financial system

              Trending Tags

                • Investing
                • Wealth
              • Retirement & Savings
                • All
                • Retirement
                • Savings
                Retirement Series #3: Choice of asset allocation. Part 2 – The allocations preferred by experts and investors

                Retirement Series #3: Choice of asset allocation. Part 2 – The allocations preferred by experts and investors

                Retirement Series #3: Choice of asset allocation. Part 1 – The effect on accumulated capital

                Retirement Series #3: Choice of asset allocation. Part 1 – The effect on accumulated capital

                Retirement Series: How much money do we need to live through retirement?

                Retirement Series: How much money do we need to live through retirement?

                Retirement Series: Part 1 – Overview – A backwards view

                Retirement Series: Part 1 – Overview – A backwards view

                How many years do our public or social pensions last?

                What is the replacement rate of retirement pensions?

                Trending Tags

                  • Retirement
                  • Savings
                • Tools
                  • All
                  • Calculators
                  • Publications
                  • Sites and apps
                  Morningstar Rating for Funds

                  Morningstar Rating for Funds

                  Morningstar’s European Active/Passive Barometer

                  Morningstar’s European Active/Passive Barometer

                  Morningstar’s U.S. Active vs. Passive Barometer

                  Morningstar’s U.S. Active vs. Passive Barometer

                  The Power of Dividends: Past, Present, and Future, Hartford Funds, 2021

                  The Power of Dividends: Past, Present, and Future, Hartford Funds, 2021

                  OECD Corporate Governance Factbook 2021

                  OECD Corporate Governance Factbook 2021

                  G20/OECD Principles of Corporate Governance, 2015

                  G20/OECD Principles of Corporate Governance, 2015

                  Trending Tags

                  • calculators
                  • Calculators
                  • Publications
                  • Sites and apps
                • More
                  • All
                  • Best of
                  Best Of Mutual Funds Series: Dividend Stocks for Investors Outside the U.S.

                  Best Of Mutual Funds Series: Dividend Stocks for Investors Outside the U.S.

                  Best Of Mutual Funds Series: Dividend Stocks for U.S. Investors

                  Best Of Mutual Funds Series: Dividend Stocks for U.S. Investors

                  Best Of Mutual Funds Series: Investment Grade Bonds, Indexed, for Eurozone Investors

                  Best Of Mutual Funds Series: Investment Grade Bonds, Indexed, for Eurozone Investors

                  Best Of Mutual Funds Series: US Bonds, Indexed, for US Investors

                  Best Of Mutual Funds Series: US Bonds, Indexed, for US Investors

                  Best Of Mutual Funds Series: Passive, US Large Stocks, for Non-US Investors

                  Best Of Mutual Funds Series: Passive, US Large Stocks, for Non-US Investors

                  Best Of Mutual Funds Series: Passive Large US Stocks for US Investors

                  Best Of Mutual Funds Series: Passive Large US Stocks for US Investors

                  Trending Tags

                    • Best of
                    • Reviews
                    • Snapshots
                    • Others
                  No Result
                  View All Result
                  Investorpolis
                  No Result
                  View All Result
                  Home Investing Series Guide

                  The charts that help us define our investor profile

                  21 de February, 2021
                  in Investing Series Guide, V. The Investor
                  Reading Time: 12 mins read
                  0 0
                  0
                  Os gráficos que nos ajudam a definir o nosso perfil de investidor
                  Share on FacebookShare on Twitter

                  There are a set of key words for a good financial plan: Investor profile, asset allocation, returns, risk, diversification, term, objectives, and financial situation and capacity

                  #1 Know the nominal and real returns of main assets, stocks and bonds, around the world: the degree of realistic ambition

                  #2 Understand the risks: trade-offs and chills in asset yields in a few years

                  #3 Assess asset returns and risks

                  #4 Understand the diversification of investments in asset allocation: the combination is worth more than the sum of the parts

                  #5 The choice of asset allocation and investments to the objectives, financial situation and capacity

                  By visualizing only 4 charts we can measure, analyse, evaluate, reflect and decide on the best combination of assets/investments, between stocks and bonds, that we want for each of our financial objectives. We look at the returns and growth of invested capital in stocks and bonds and the measure of the trade-off between these two assets, the dilution of the risk of the stocks by increasing the investment period, the diversification of risk through combinations of assets, and the relationships between objectives and investment terms.

                  We know the intra-annual corrections of stocks, the frequency and the values of positive and negative returns of stocks for various periods of investment, the largest devaluations in stocks and their recovery time.

                  There are a set of key words for a good financial plan: Investor profile, asset allocation, returns, risk, diversification, term, objectives, and financial situation and capacity

                  These are the key words for a good financial plan and investments decision making.

                  Knowing our investor profile is essential to have a good financial plan. Our investor profile is critical to establishing the most appropriate asset allocation to our objectives and financial situation.

                  Asset allocation is the main determinant of expected return and risk of investments. Thus, the profile determines the asset allocations and expected investment performance.

                  In addition, the better we draw our profile, the more confident we will be with investment choices. This makes us more disciplined in investments and it will be more difficult for us to change course in the face of normal market fluctuations.  

                  Doing a good self-profiling is at the root of the success of investments.

                  There are several ways to evaluate our investor profile. On the one hand, we form an idea of our profile when we realize how we compare ourselves in terms of investment behaviours vis-a-vis people in our family or friends. On the other hand, we have the questionnaires made by the academy or that the financial industry uses, from simpler to more complete. Finally, we also have the evaluations made for our financial advisors.

                  But one way we find especially useful is the exercise of self-assessment based on historical information charts on key financial assets and investments. Each of us knows and reflects on the characteristics of the assets and their suitability for our specific personal case.

                  Visualisation is useful because “a chart is worth a thousand words.” And we have chosen graphics that best portray the aspects covered.

                  Before we go any further, it is important that we make two clarifications.

                  First, we will look at only the two main classes of financial assets, stocks, and bonds, the most common, most used and those universally recommended by financial experts. This means that we will not consider monetary investments such as bank deposits, savings accounts, or equivalents due to their low attractiveness, nor alternative investments such as real estate, venture capital or hedge funds, mainly due to their complexity.

                  Second, we will present the markets or market indices returns, both for stocks and bonds. We will not talk about a specific stock or bond, nor about a set or investment fund whether of shares or bonds, because this would not allow generalizations and draw conclusions with practical value.

                  The best way to think is to look at the conditions and conclusions, reflect deeply on their meaning and implications, try to understand how to live with investments and only then decide.

                  The investor profile is the #1 indicator or the best thermometer for selecting the financial assets in which to invest.

                  #1 Know the nominal and real returns of main assets, stocks and bonds, around the world: the degree of realistic ambition

                  Let us look at the evolution of capital growth as well as the average nominal returns of investments in the US stock market and 10-year US treasury bonds from 1926 to 2018, which are updated annually by Morningstar Ibbotson:

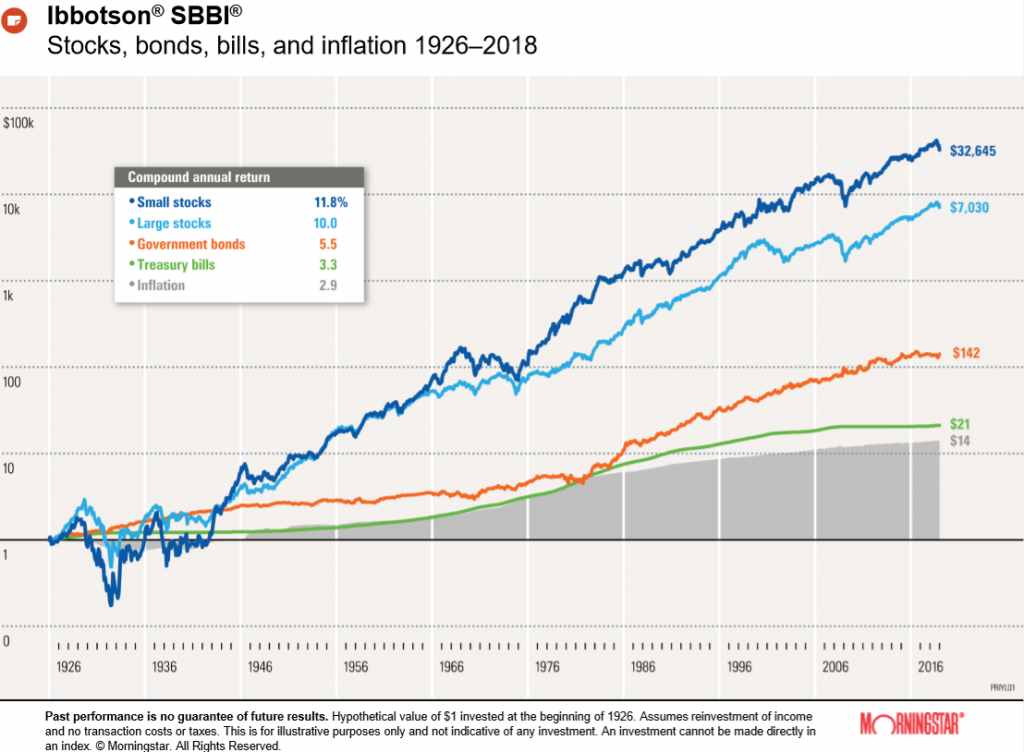
                  In this period, small company stocks had an average nominal return of 11.8%, large company stocks of 10%, 10-year treasury bonds of 5.5% and 3-month treasury bills of 3.3%, with an average annual inflation of 2.9%. A dollar invested in each of these assets would have yielded $32,600 in small business stocks, $7,000 in large company stocks, $142 in treasury bonds and $21 in treasury bills (just above the loss of purchasing power or the cost of $14 of inflation).

                  Credit Suisse updates annually in its Global Investment Returns Yearbook the average annual returns, in nominal (or monetary) and real (deducted from inflation) terms of the main indices of the national stock markets and the 10-year treasury bonds of each country, from 1900 to date.

                  For the US, the values were as follows:

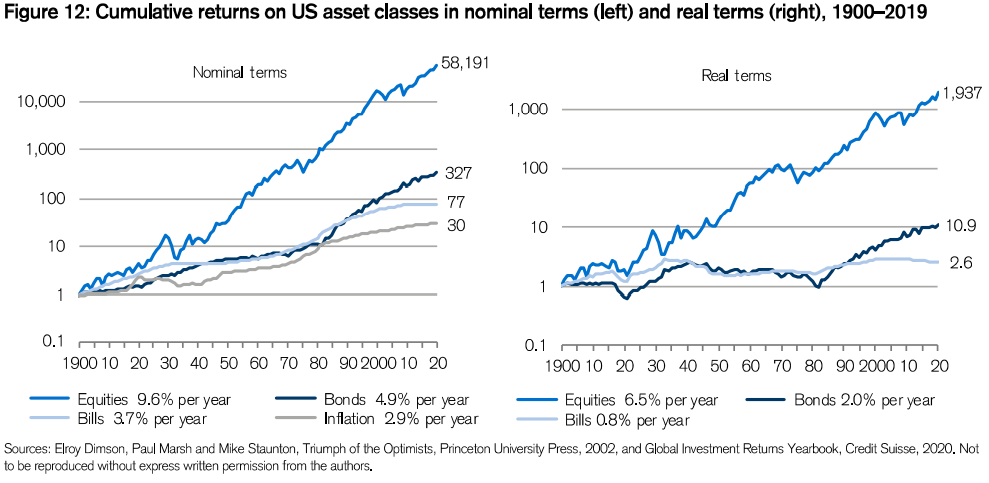
                  The graph on the left shows the average nominal or monetary returns of the several investments between 1900 and 2019. They were 9.6% in the equities, 4.9% in treasury bonds and 3.7% in treasury bills, with an average inflation of 2.9%. A dollar invested in 1900 would have generated in 2019 a capital of $58,200 in equities, $327 in bonds and $77 in treasury bills.

                  The graph on the right shows the average real or inflation-corrected returns of the various investments between 1900 and 2019. They were 6.5% in the equities, 2.0% in treasury bonds and 2.6% in treasury bills. A dollar invested in 1900 would have generated in 2019 an equivalent capital in terms of purchasing power of $1,900 in equities, $11 in bonds and only $3 in treasury bills.

                  The same publication also presents the annual the average real returns for other countries of the world:

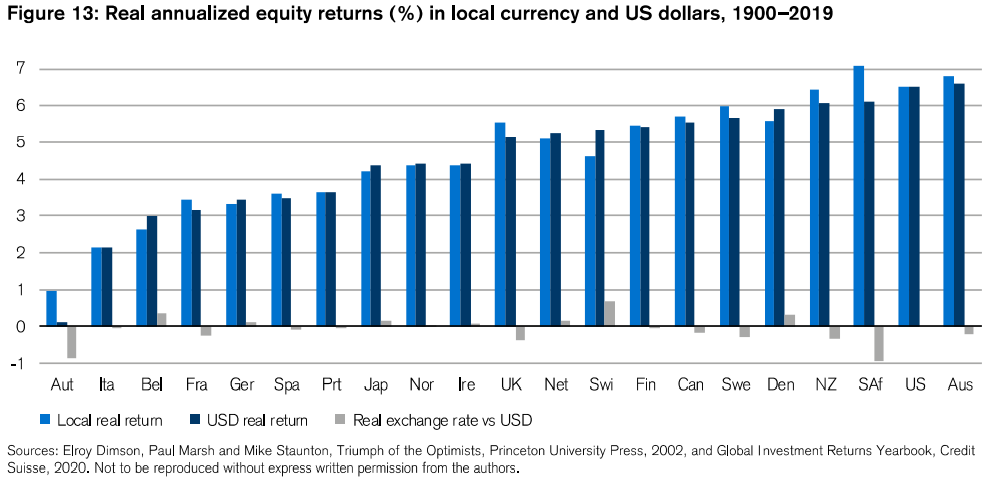
                  In most countries, these average annual real returns are between 4% and 6% (nominal or monetary returns would be 2% to 3% higher), being higher in the US, average in the UK and lower in countries plagued by world wars such as Italy, France, Germany and Japan.

                  The same publication shows the equities returns difference to bonds and treasury bills (also called stock risk premiums) for the same countries:

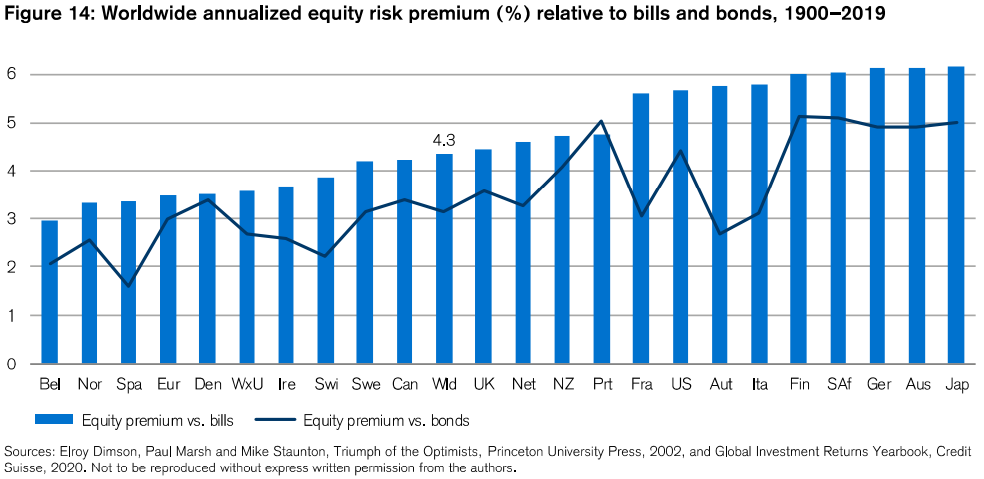
                  Thus, in most countries, equities had average annual nominal returns between 3% and 6% compared to treasury bonds, 4.3% in the world, 6% in the USA and 3.5% in Europe, with the highest premiums recorded in the countries affected by the two world wars of the last century.

                  Before we move on to the risks it is worth seeing how these percentage differences in rates of return translate into capital values accumulated in the following table:

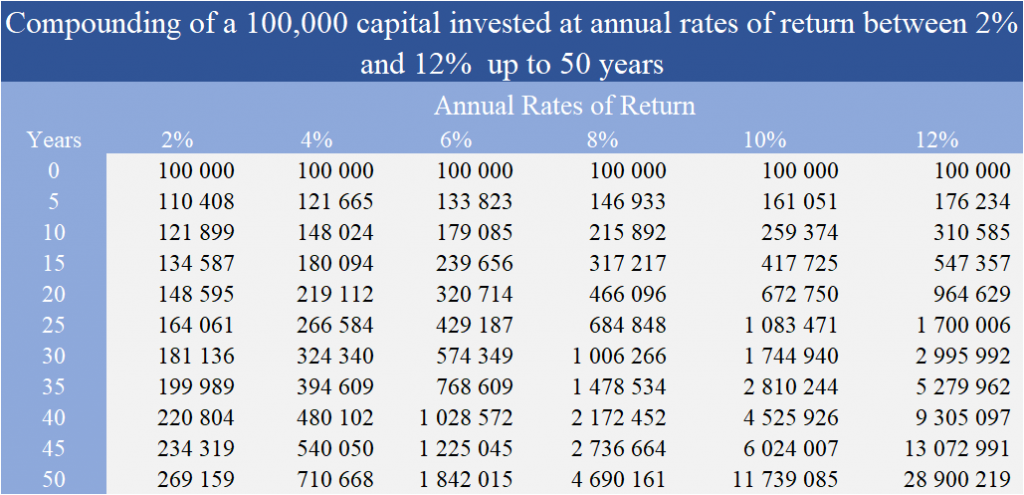
                  Over a 50-year period, an initial capital investment of 100,000 monetary units (m.u.) generates an accumulated capital of 269,000 m.u. with a return rate of 2% per year, 710,000 m.u. with 4%, 1.8 million m.u. at 6%, 6.7 million m.u. at 6%, and so on. These differences are already very large after 25 years: 164,000 m.u. at 2%, 266,000 m.u. at 4%, 429 m.u. at 6%, 684 m.u. at 8%, etc. Even in a shorter period of 10 years, the differences are already significant: 121,000 m.u. to 2%, 148,000 m.u. to 4%, 179,000 m.u. to 6%, 216,000 m.u. to 8%, etc.

                  #2 Understand the risks: trade-offs and chills in asset yields in a few years

                  #3 Assess asset returns and risks

                  In some of the previous charts we have seen that the capital growth, especially in equities, was not linear, i.e. there were moments of greater and minor advances, and even others of setbacks or negative returns.

                  The following chart also known as frequency histogram shows how annual returns of the US stock market were distributed over the 145-year period between 1872 and 2018:

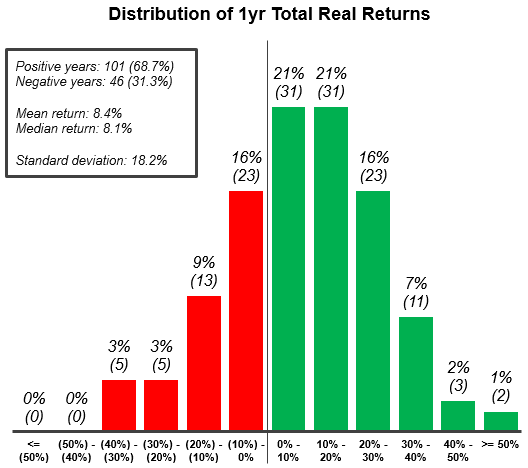
                  With the average annual return being 8.4%, returns were positive in 68.7% of the years, and negative in the remaining 31.3%. There were years when returns exceeded 30% (16 years), but there were also years when they had negative returns of more than 30% (5 years).

                  Trade-offs on time or the ability to wait and let go: in the end it’s all a matter of time

                  We have seen that stock markets are more profitable but are more volatile than bondholders.  This volatility or risk is higher in the short term, diluting over time.

                  As we can see in this chart prepared by JP Morgan Asset Management regarding the behaviour of the main index of the US stock market, the S&P 500, between 1980 and March 2020, the stock markets have significant corrections every year:

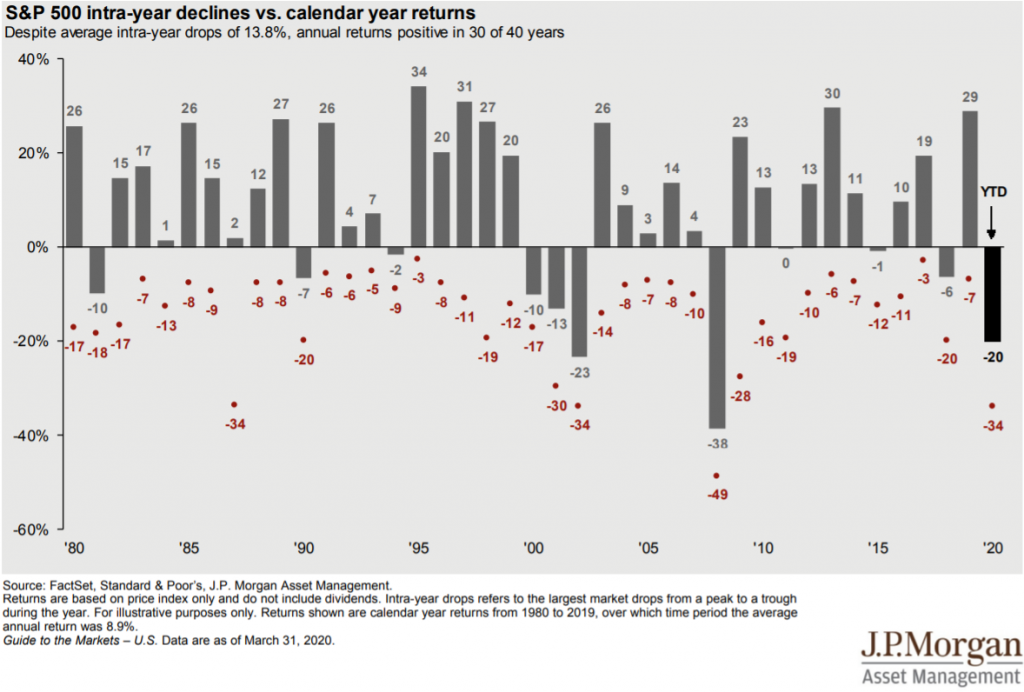
                  In this 40-year period, there have been many years (23 years) in which the stock market came to have losses of more than 10%, but eventually recovered in most cases. Only 10 of those years had negative returns at the end of the year.

                  This risk or volatility can also be seen by the assessment of the average annual returns observed by the same S&P 500 index in various investment periods, 1 year, 5 years, 10 years and 20 years between 1926 and 2017, as Morninsgstar shows us:

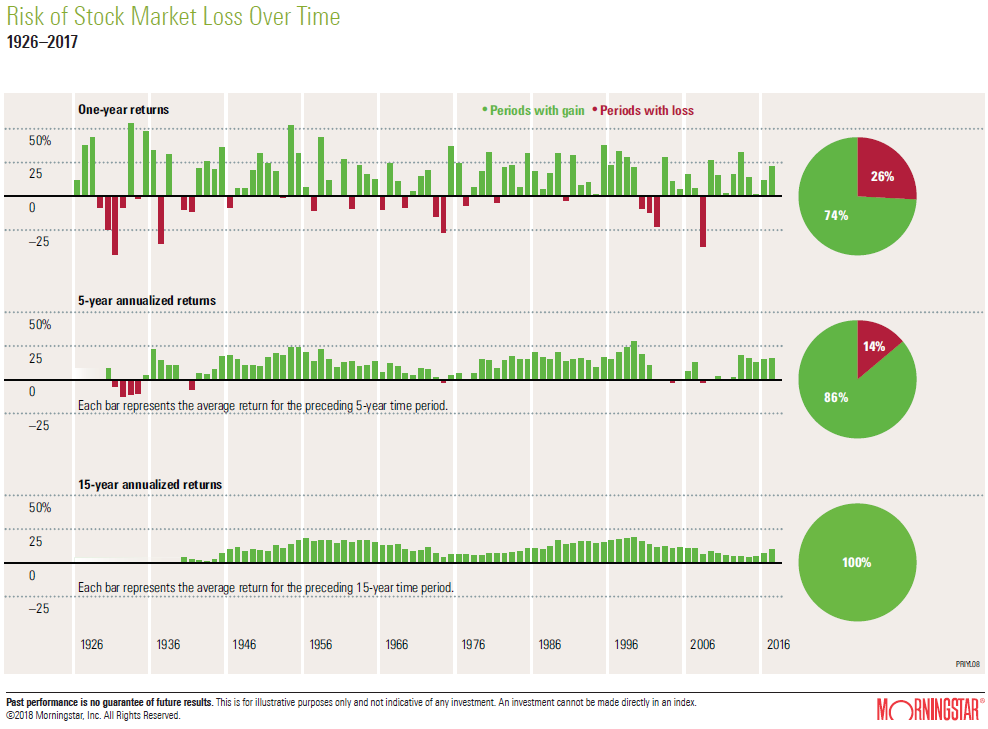
                  In this period of more than 90 years, only 26% had negative annual returns. Considering the 85 5-year periods, only in 14% of these periods there were negative annual returns. And if we consider the 75 15-year periods, there was not even one with negative returns, that is, all had positive returns. This means that stock markets are volatile and risky especially in the short term because in the medium- and long-term losses are recovered and quickly disappear.

                  The chills of asset returns in a few years: the punches in our belly or how good is our stomach

                  As important as to look at the number of years and the statistics in which we have negative returns is to analyse the severity of these losses.

                  There is no better way to assess our ability to react to adversity than to highlight the worst-case scenario. This measure is given to us by the drawdown concept which is nothing more than the largest possible devaluation of invested capital, that is, the negative change in capital since the last highest value (of the financial markets).

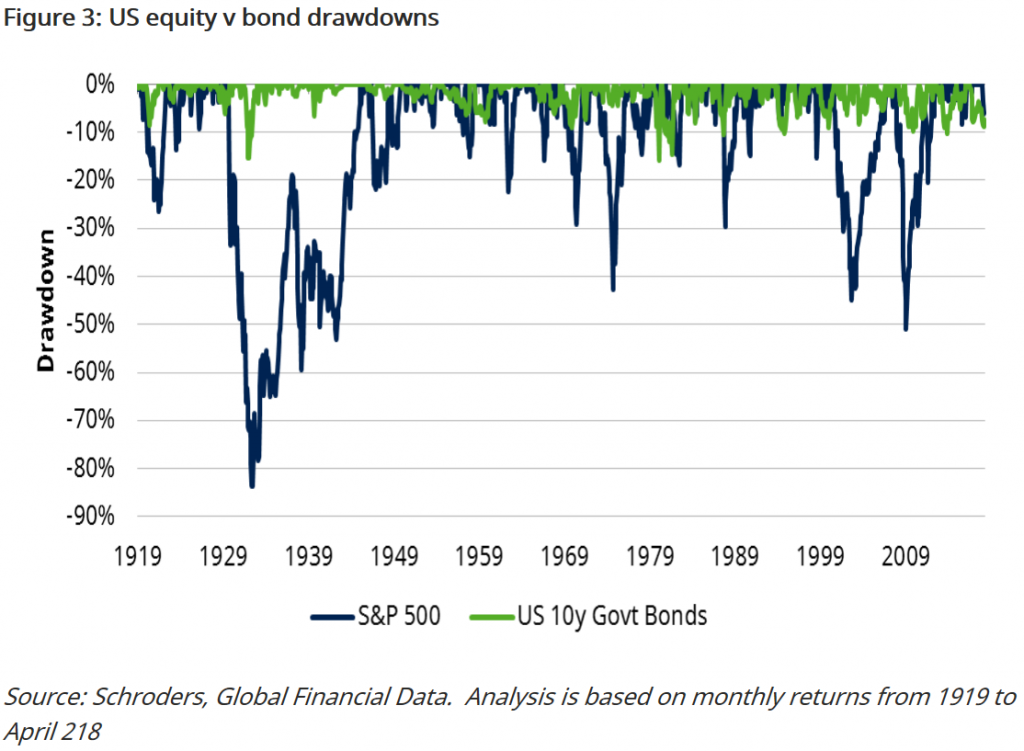
                  The following two charts produced by Schroders show the largest capital devaluations incurred by equity and bond investors between 1919 and 2018 for the U.S. 

                  In this chart we can see once again that the biggest devaluations are much more pronounced in stocks than in bonds, i.e. those are much more volatile:

                  In the following chart we can see the 10 worst drawdowns in the period between 1919 and 2018:

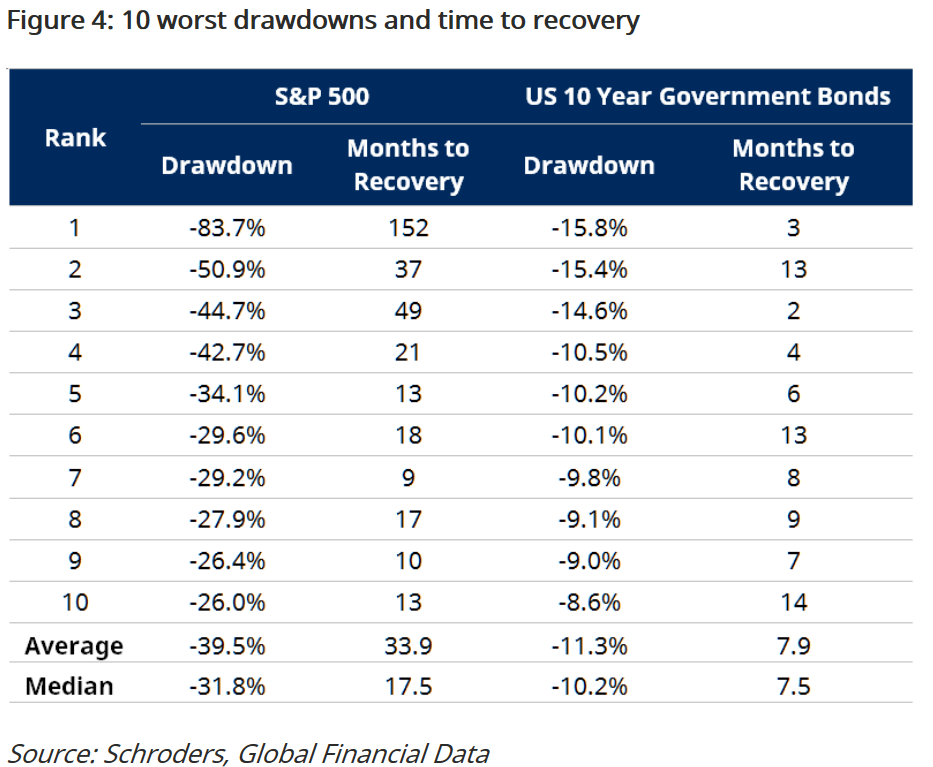
                  The average devaluation was 39.5% and lasted almost 34 months or just under 3 years to recover. Generally speaking, as you would expect, the higher the devaluation the longer it takes to recover.  The largest devaluation, of 83.7%, which occurred during the Great Depression in 1929, took 152 months or more than 12 years to recover. The second largest, 51% took 37 months or 3 years and the third was 44.7% and took 4.5 years. All 7 remaining were recovered in less than 2 years, or 21 months.

                  #4 Understand the diversification of investments in asset allocation: the combination is worth more than the sum of the parts

                  It is rare for investors to invest 100% either in stocks or bonds. Usually, they make a combination of these two classes.

                  The following is a chart prepared by Vanguard showing the average nominal returns of combinations of investment in US stocks and treasury bonds by variable percentages of 10% between 1926 and 2018:

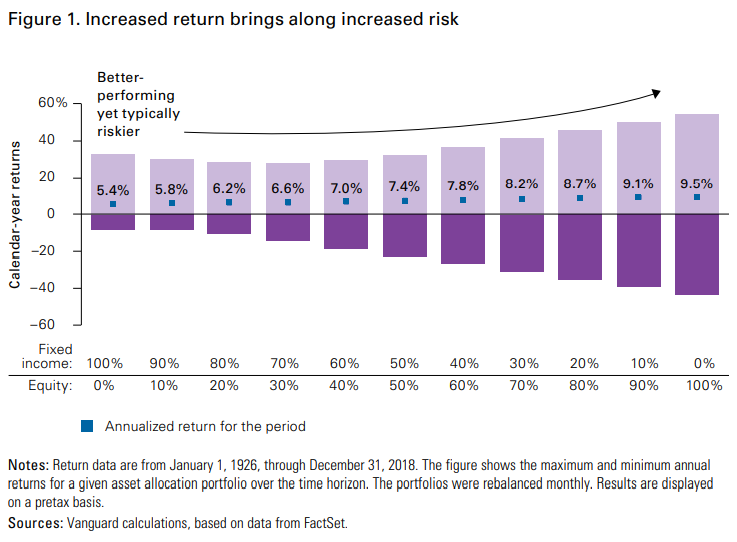
                   The combination of the 2 assets is worth more than the sum of the parts to the extent that they have different evolutions and, in many cases, when one of them depreciates the other appreciates and vice versa. In other words, these two assets have independent or decorrelated behaviours, and even in many cases negative correlations.

                  This is very noticeable from the reading of the following chart showing the returns on investments for 30 years in the US stock market and treasury bonds between 1830 and 2010:

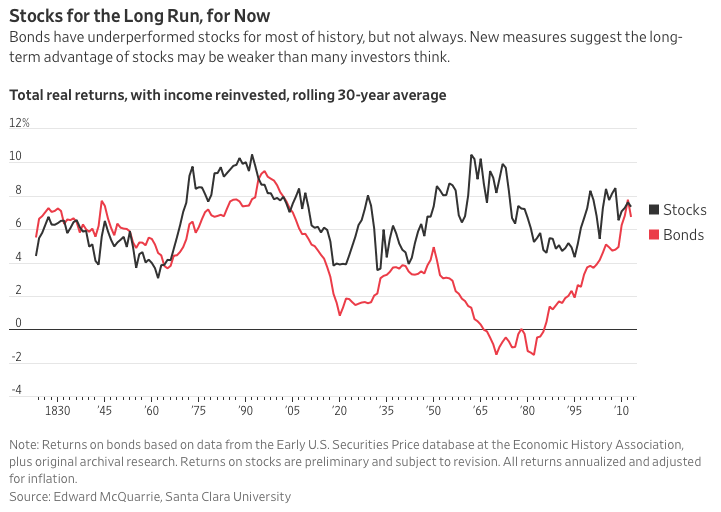
                  It is quite clear that in the periods when the return on the stock market was higher those of the bonds were lower (1950 to 1980) and vice versa (1990-2010).

                  #5 The choice of asset allocation and investments to the objectives, financial situation, and capacity

                  The choice of allocation is influenced by the objective and financial situation of the investor.

                  There are several competing financial objectives for available capital and not everyone has the same priority as the same timeframe. We have short-, medium- and long-term financial objectives:

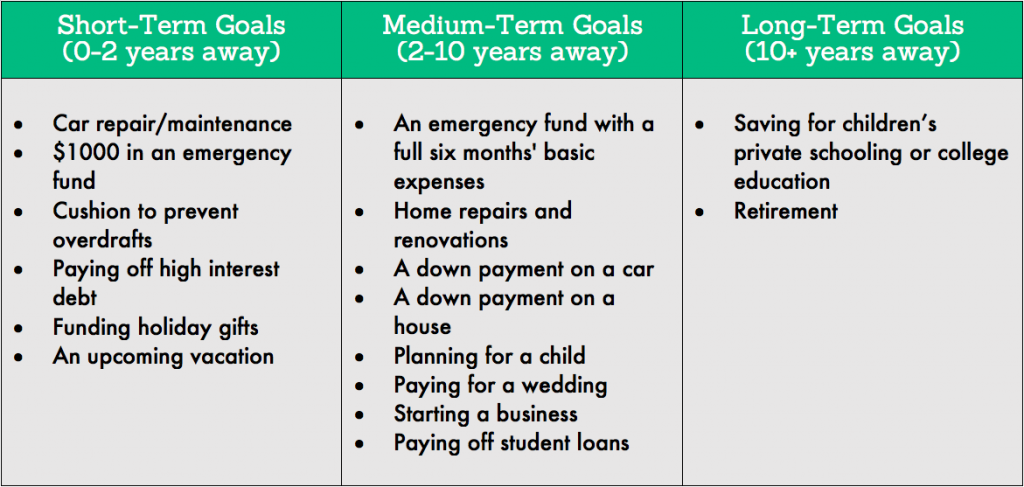
                  In the short term, up to 2 years, we have objectives such as paying off debts and setting up a small emergency fund. In the medium term, between 2 and 10 years, we have the build-up of a full emergency fund that is equivalent to 6 months of salaries or down payments for the purchases of a car, a house, etc. In the long term, more than 10 years, we find the fees for the college education of children and the personal retirement fund.

                  As we have seen the longer the term, the lower the probability and severity of the devaluation and, therefore, the risk, so the longer the term the more you should invest in stocks to obtain the highest expected returns.

                  We also know that the better the financial situation and capacity the more one can risk. That is why the richer one gets, the more he invests in stocks. Those who have more can support much better the fluctuations of the short-term market because they do not need the money to live the day-to-day.

                  Previous Post

                  Is the take-off of the US stock market here to stay? Part II – Analysis, Evaluation and Conclusions

                  Next Post

                  Investor biases: Recency or Short Memory

                  Investadmin

                  Investadmin

                  Related Posts

                  Choosing Mutual Funds Series: Part 7 – The Largest Fund Management Companies
                  Investing Series Guide

                  Choosing Mutual Funds Series: Part 7 – The Largest Fund Management Companies

                  22 de May, 2023
                  Maximizing the time invested in the stock market instead of choosing the times to invest: Part 3 – The market cycles and the mean reversion
                  Investing Series Guide

                  Maximizing the time invested in the stock market instead of choosing the times to invest: Part 3 – The market cycles and the mean reversion

                  14 de April, 2023
                  Choose P4 Mutual funds series – Evaluate and use the benchmarks and ratings of funds
                  Investing Series Guide

                  Choose P4 Mutual funds series – Evaluate and use the benchmarks and ratings of funds

                  27 de March, 2023
                  Simple Portfolios (DIY) Series Part 3: The traditional 60/40 Portfolio, the pros and cons, and how to execute it
                  Investing Series Guide

                  Simple Portfolios (DIY) Series Part 3: The traditional 60/40 Portfolio, the pros and cons, and how to execute it

                  27 de March, 2023
                  Investing in Secular Stocks Series: Part 4.1 – The 3 Valuation Methods and Fundamental Analysis
                  Investing Series Guide

                  Investing in Secular Stocks Series: Part 4.1 – The 3 Valuation Methods and Fundamental Analysis

                  27 de March, 2023
                  Simple Portfolio Series (DIY) Part 2: The Traditional Portfolio 60/40, what it is, for whom, and its performance
                  Investing Series Guide

                  Simple Portfolio Series (DIY) Part 2: The Traditional Portfolio 60/40, what it is, for whom, and its performance

                  28 de January, 2023
                  Next Post
                  Enviesamentos investidor: Memória Recente

                  Investor biases: Recency or Short Memory

                  Leave a Reply

                  Your email address will not be published. Required fields are marked *

                  Trending

                  Insurance Series: Part 2.1 – Life insurance: Description and characteristics

                  Insurance Series: Part 2.1 – Life insurance: Description and characteristics

                  25 de May, 2023
                  Choosing Mutual Funds Series: Part 7 – The Largest Fund Management Companies

                  Choosing Mutual Funds Series: Part 7 – The Largest Fund Management Companies

                  22 de May, 2023
                  Maximizing the time invested in the stock market instead of choosing the time to invest: Part 2.2 – Stock cycles and reversion to the mean

                  Maximizing the time invested in the stock market instead of choosing the time to invest: Part 2.2 – Stock cycles and reversion to the mean

                  15 de May, 2023
                  Series How Women Invest: Part 3 – The 5 investment gaps and the retirement problem

                  Series How Women Invest: Part 3 – The 5 investment gaps and the retirement problem

                  8 de May, 2023
                  Investorpolis

                  We developed this blog because we believe that only a small learning effort is needed to make a big change in the decisions and results of our investments and financial assets.

                  Main categories

                  • Investing Series Guide
                  • Wealth and Investing
                  • Retirement & Savings
                  • Tools
                  • More

                  Newsletter

                  Sign to our mailing list to receive updates direct to your inbox!

                  *We don’t spam

                  • Privacy Policy
                  • Cookie Policy
                  • Contacts

                  © 2021 - Investorpolis / Powered by Delta Soluções

                  • pt-pt Português
                  • fr Français
                  • es Español
                  • en English
                  • Home
                  • Investing Series Guide
                    • I. Goal Based Investing
                    • II. Compounding & Inflation
                    • III. Assets Risks & Returns
                    • IV. Efficient Diversification
                    • IX. Sustainable Investing and ESG
                    • V. The Investor
                    • VI. Assets and Investments
                    • VII. Index Funds
                    • VIII. Successful Investing
                    • X. Kits and Tips
                    • XI. Other Topics
                  • Retirement & Savings
                    • Retirement
                    • Savings
                  • Wealth and Investing
                    • Investing
                    • Wealth
                  • Tools
                    • Calculators
                    • Publications
                    • Sites and apps
                  • More
                    • Best of
                    • Reviews
                    • Snapshots
                    • Others
                  • About us
                    • Who we are
                    • Mission
                  • Login
                  • Sign Up
                  • Cart

                  © 2021 - Investorpolis / Powered by Delta Soluções

                  Welcome Back!

                  Login to your account below

                  Forgotten Password? Sign Up

                  Create New Account!

                  Fill the forms bellow to register

                  All fields are required. Log In

                  Retrieve your password

                  Please enter your username or email address to reset your password.

                  Log In
                  We use cookies on our website to give you the most relevant experience by remembering your preferences and repeat visits. By clicking “Accept All”, you consent to the use of ALL the cookies. However, you may visit "Cookie Settings" to provide a controlled consent.
                  Cookie configurationCookie PolicyAcceptReject
                  Manage consent

                  Privacy Overview

                  This website uses cookies to improve your experience while you navigate through the website. Out of these, the cookies that are categorized as necessary are stored on your browser as they are essential for the working of basic functionalities of the website. We also use third-party cookies that help us analyze and understand how you use this website. These cookies will be stored in your browser only with your consent. You also have the option to opt-out of these cookies. But opting out of some of these cookies may affect your browsing experience.
                  Advertisement
                  Advertisement cookies are used to provide visitors with relevant ads and marketing campaigns. These cookies track visitors across websites and collect information to provide customized ads.
                  Analytics
                  Analytical cookies are used to understand how visitors interact with the website. These cookies help provide information on metrics the number of visitors, bounce rate, traffic source, etc.
                  Functional
                  Functional cookies help to perform certain functionalities like sharing the content of the website on social media platforms, collect feedbacks, and other third-party features.
                  Necessary
                  Necessary cookies are absolutely essential for the website to function properly. These cookies ensure basic functionalities and security features of the website, anonymously.
                  Others
                  Other uncategorized cookies are those that are being analyzed and have not been classified into a category as yet.
                  Performance
                  Performance cookies are used to understand and analyze the key performance indexes of the website which helps in delivering a better user experience for the visitors.
                  SAVE & ACCEPT

                  Add New Playlist

                  Are you sure want to unlock this post?
                  Unlock left : 0
                  Are you sure want to cancel subscription?