• About us
    • Who we are
    • Mission
  • Contacts
  • English
    • Português (Portuguese (Portugal))
    • Español (Spanish)
    • Français (French)
  • Login
Investorpolis
[xyz-ips snippet="Banners-Publicitarios"]
No Result
View All Result
No Result
View All Result
Investorpolis
No Result
View All Result
Home Wealth and Investing Investing

Maximizing the time invested in the stock market instead of choosing the time to invest: Part 2.2 – Stock cycles and reversion to the mean

15 de May, 2023
in Investing, Wealth and Investing
Reading Time: 7 mins read
0 0
0
Maximizing the time invested in the stock market instead of choosing the time to invest: Part 2.2 – Stock cycles and reversion to the mean
Share on FacebookShare on Twitter

The stock market has several cycles, but it always grows and reverts to the mean

The averages of the PER valuation multiple

The average of 10-year returns and CAPE multiples

Average returns over 10-year periods show a succession of large cycles or waves of 25 to 30 years

The market always ends up recovering and making new highs

In the medium and long term, investing in stocks is very attractive in terms of returns and risk

The stock market has several cycles, but it always grows and reverts to the mean

In a previous article we looked at what market timing is and the huge costs to the many investors who pursue it.

In the previous article, which is the first part of this topic, we have addressed market cycles, from the very short-term to the longest.

The conclusion is that it is not possible to anticipate the cycles.

The cycles are natural and frequent, and more, they are amplified by speculative behaviors.

Agents who behave like this usually lose a lot of money.

Later we will see, on the contrary, that those who do not do it “market timing”, accept the unpredictability of cycles as the nature of the market itself, are the ones who win the most.

In this second part we focus on how these cycles develop.

We have seen previously that negative market fluctuations, daily, annual, or cyclical, are corrected.

Basically, the market recovers from the losses. And it goes up a lot, valuing our invested capital.

In the following charts we will see that the market fluctuations show that there is a reversal to an average.

That is, that the performance of the market is made in a winding path around a positively inclined straight line, of growth, advancement and progression.

There are deviations around this straight line, which are corrected over time.

In fact, the market has had an average annual return of about 10% in nominal terms or 6.5% in real terms (Siegel’s constant) since 1926.

However, evolution is not linear.

There are many fluctuations, some small and some excessive.

But the market always returns to that middle line of growth.

Let’s see this reality in various forms.

The following graph shows the deviations of the marker index from the 1-year averages (52 weeks) between 1960 and 2020:

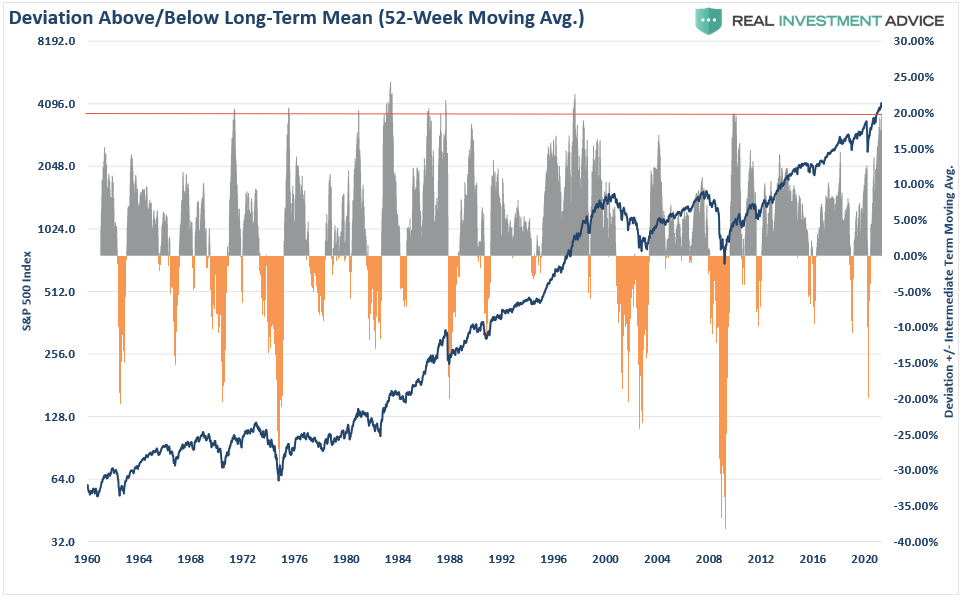
The red line traces the maximum value of the deviations and marks 20%.

That is, there has been a correction whenever the market trades at more than 20% of its annual average.

In the downward direction it is not possible to find the same pattern.

However, there were only two negative deviations greater than 20%, in 1973 and 2008.

This chart shows well what we have seen in other articles regarding the corrections.

There are frequent technical corrections, between 10% and 20%, and other more deep corrections, greater than 20%, also called crises.

Next, we will look to see if it is possible to detect any relationship, or pattern of behavior, between the performance of the market and the main valuation multiple, the PER.

The averages of the PER valuation multiples

The following chart shows the evolution of the S&P 500 comparing it to what would have occurred for historical PER multiples of 10x, 15x, and 20x between 1970 and 2022:

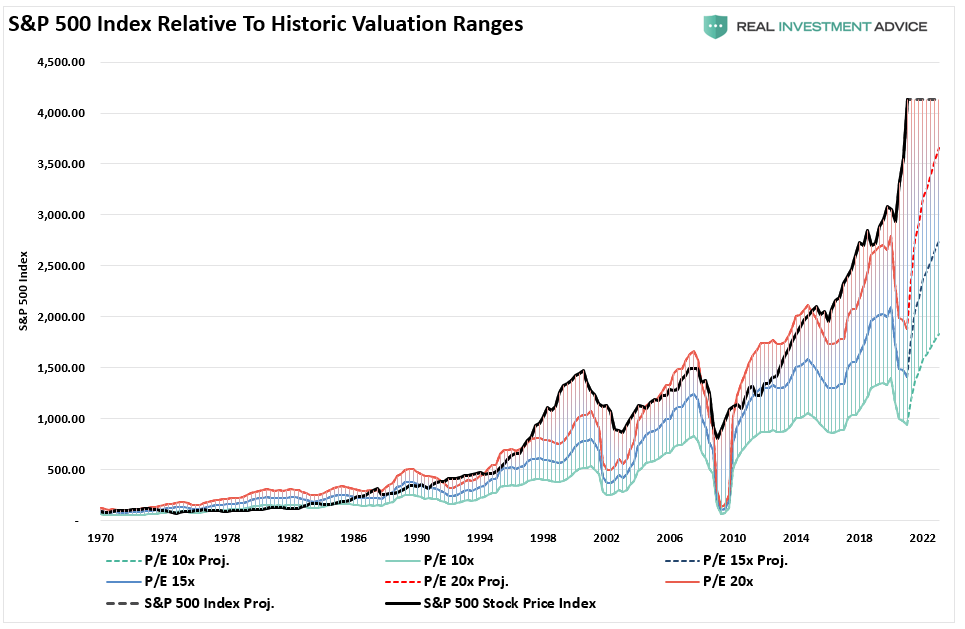
They are the deviations from the assessment.

Until the 80s, the market traded with a PER of 10x.

Since then, the market has been trading closer to a multiple of 20x, mainly due to the change in policy of the monetary authorities.

Between 1982 and 1999 the market appreciated considerably, trading with a PER greater than 20x.

Since the tech bubble, the market has returned to trading at a PER of 20x, until it took off again from 2015.

We can also see this evidence of the reversal to the average in annualized returns.

The following graph shows the evolution of average annual returns over 10-year investment periods and the CAPE multiple (Schiller’s PER) since 1910:

The average of 10-year returns and CAPE multiples

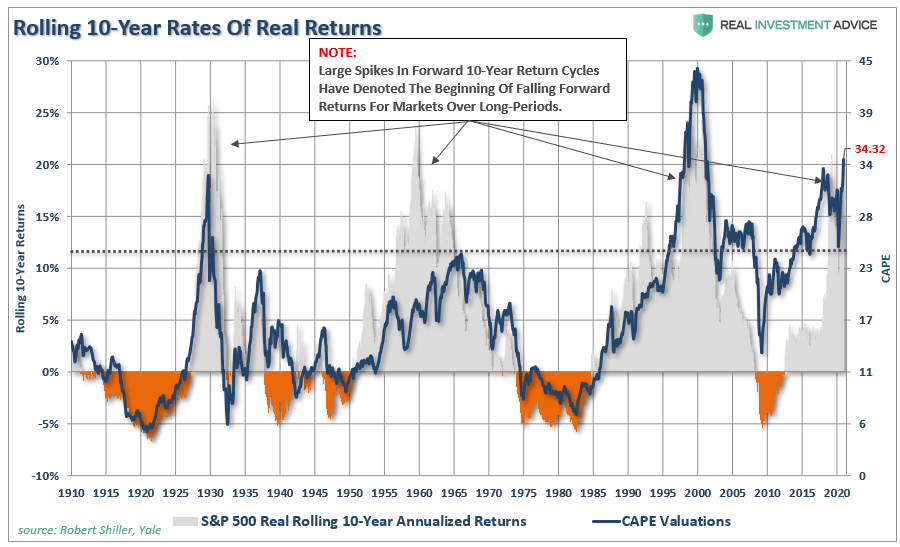
Whenever the market shows big returns in 10-year cycles, it eventually corrects.

The dashed line shows the CAPE average of the last 10 years, about 25x.

Average yields over 10-year periods show a succession of large cycles or waves of 25 to 30 years

It is very interesting to analyze the cycles of stock market returns for periods of 10 years:

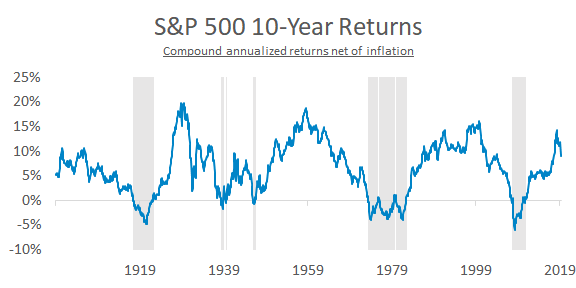
For average annual returns of 10-year investment periods, the market shows waves or cycles of about 20 to 30 years, more or less symmetrical, in which a maximum of 20% of average annual profitability is reached for 10 years.

The market always ends up recovering and making new highs

At the end of the day, or cycles, the market always recovers.

The following chart shows the cumulative returns of an investment portfolio of 60% stocks and 40% liquidity in major stock market crises since 1992, and their recoveries:

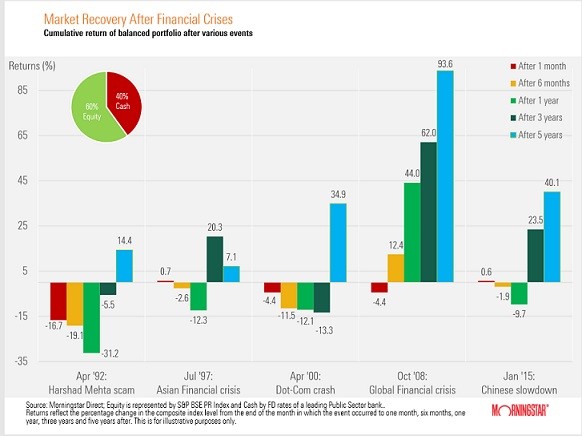
In 1992, the portfolio fell 31% after one year, but recovered to a 14% appreciation after 5 years.

In the Asian Crise of 1997, the fall of 12.3% after 1 year was overcome with an appreciation of 20% after 3 years.

During the tech bubble of 2000, the portfolio lost 13% in 3 years, but by the fifth year it had already appreciated by 35%.

In the GCF of 2007 and the crisis of 2015, the recoveries were even more impressive, in terms of speed and size.

The following logarithmic graph draws the evolution of the S&P 500 in real terms (adjusted for inflation) from 1870 to 2020 and the positive regression line, which shows the deviations:

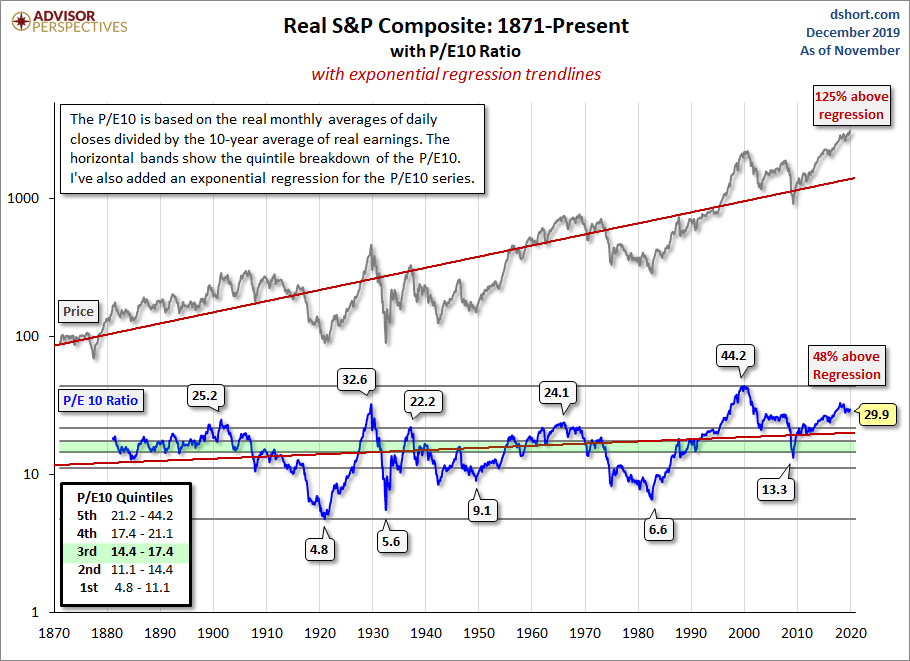
What it shows is that the market has an important long-term appreciation, in which fluctuations or deviations in the shorter timeframes end up regressing to this average straight line.

In the medium and long term, investing in stocks is very attractive in terms of profitability and risk

The following chart details long-term stock market yields, using data since 1926:

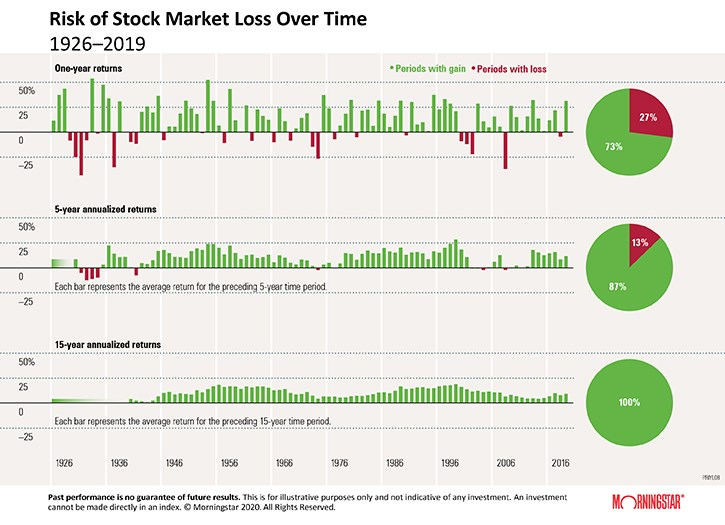
There are 93 years of annualized returns, for periods of 1, 5 and 15 years.

73% of the years had positive returns.

If we move from annual returns to annualized returns over a 5-year period, we already have 87% periods with positive returns.

And if we look at annualized returns over a longer period of 15 years, negative returns have never been observed

In conclusion, the longer the investment term, the lower the probability or risk of negative returns.

And as we saw earlier, these average annual returns are 10% per year.

Previous Post

How Women Invest Series: Part 3 – The 5 investment gaps and the retirement problem

Next Post

Choosing Mutual Funds Series: Part 7 – The Largest Fund Management Companies

Feria

Feria

Related Posts

Effects of Trump’s Trade Tariffs on Financial Investments Series: P1 – Framework
Investing

Effects of Trump’s Trade Tariffs on Financial Investments Series: P1 – Framework

8 de May, 2025
Series Investments in the Artificial Intelligence Cycle: Part 2 – The main branches of AI
Investing

Series Investments in the Artificial Intelligence Cycle: Part 2 – The main branches of AI

29 de April, 2025
2Q25 Financial Markets Outlook: Zombieconomics, or the monumental cost of Trump’s astronomical reciprocal tariffs
Investing

2Q25 Financial Markets Outlook: Zombieconomics, or the monumental cost of Trump’s astronomical reciprocal tariffs

4 de April, 2025
Thematic Investments Series: Part 3. What are the main megatrends?
Investing

Thematic Investments Series: Part 3. What are the main megatrends?

28 de March, 2025
Thematic Investments Series: Part 2.2. Disruptive technology or innovation – The domains of disruptive technology or innovation
Investing

Thematic Investments Series: Part 2.2. Disruptive technology or innovation – The domains of disruptive technology or innovation

17 de March, 2025
Investments in the Artificial Intelligence Cycle Series: Part 1 – Definition and History of Development
Investing

Investments in the Artificial Intelligence Cycle Series: Part 1 – Definition and History of Development

20 de February, 2025
Next Post
Choosing Mutual Funds Series: Part 7 – The Largest Fund Management Companies

Choosing Mutual Funds Series: Part 7 – The Largest Fund Management Companies

Leave a Reply

Your email address will not be published. Required fields are marked *

Trending

Effects of Trump’s Trade Tariffs on Financial Investments Series: P1 – Framework

Effects of Trump’s Trade Tariffs on Financial Investments Series: P1 – Framework

8 de May, 2025
Series Investments in the Artificial Intelligence Cycle: Part 2 – The main branches of AI

Series Investments in the Artificial Intelligence Cycle: Part 2 – The main branches of AI

29 de April, 2025
2Q25 Financial Markets Outlook: Zombieconomics, or the monumental cost of Trump’s astronomical reciprocal tariffs

2Q25 Financial Markets Outlook: Zombieconomics, or the monumental cost of Trump’s astronomical reciprocal tariffs

4 de April, 2025
Thematic Investments Series: Part 3. What are the main megatrends?

Thematic Investments Series: Part 3. What are the main megatrends?

28 de March, 2025
Investorpolis

We developed this blog because we believe that only a small learning effort is needed to make a big change in the decisions and results of our investments and financial assets.

Main categories

  • Investing Series Guide
  • Wealth and Investing
  • Retirement & Savings
  • Tools
  • More

Newsletter

Sign to our mailing list to receive updates direct to your inbox!

*We don’t spam

  • Privacy Policy
  • Cookie Policy
  • Contacts

© 2021 - Investorpolis / Powered by Delta Soluções

  • pt-pt Português
  • fr Français
  • es Español
  • en English
  • Home
  • Investing Series Guide
    • I. Goal Based Investing
    • II. Compounding & Inflation
    • III. Assets Risks & Returns
    • IV. Efficient Diversification
    • IX. Sustainable Investing and ESG
    • V. The Investor
    • VI. Assets and Investments
    • VII. Index Funds
    • VIII. Successful Investing
    • X. Kits and Tips
    • XI. Other Topics
  • Retirement & Savings
    • Retirement
    • Savings
  • Wealth and Investing
    • Investing
    • Wealth
  • Tools
    • Calculators
    • Publications
    • Sites and apps
  • More
    • Best of
    • Reviews
    • Snapshots
    • Others
  • About us
    • Who we are
    • Mission
  • Login
  • Cart

© 2021 - Investorpolis / Powered by Delta Soluções

Welcome Back!

Login to your account below

Forgotten Password?

Retrieve your password

Please enter your username or email address to reset your password.

Log In
We use cookies on our website to give you the most relevant experience by remembering your preferences and repeat visits. By clicking “Accept All”, you consent to the use of ALL the cookies. However, you may visit "Cookie Settings" to provide a controlled consent.
Cookie configurationCookie PolicyAcceptReject
Manage consent

Privacy Overview

This website uses cookies to improve your experience while you navigate through the website. Out of these, the cookies that are categorized as necessary are stored on your browser as they are essential for the working of basic functionalities of the website. We also use third-party cookies that help us analyze and understand how you use this website. These cookies will be stored in your browser only with your consent. You also have the option to opt-out of these cookies. But opting out of some of these cookies may affect your browsing experience.
Advertisement
Advertisement cookies are used to provide visitors with relevant ads and marketing campaigns. These cookies track visitors across websites and collect information to provide customized ads.
Analytics
Analytical cookies are used to understand how visitors interact with the website. These cookies help provide information on metrics the number of visitors, bounce rate, traffic source, etc.
Functional
Functional cookies help to perform certain functionalities like sharing the content of the website on social media platforms, collect feedbacks, and other third-party features.
Necessary
Necessary cookies are absolutely essential for the website to function properly. These cookies ensure basic functionalities and security features of the website, anonymously.
Others
Other uncategorized cookies are those that are being analyzed and have not been classified into a category as yet.
Performance
Performance cookies are used to understand and analyze the key performance indexes of the website which helps in delivering a better user experience for the visitors.
SAVE & ACCEPT

Add New Playlist

Are you sure want to unlock this post?
Unlock left : 0
Are you sure want to cancel subscription?