#3 We may lose some of the best daily returns on the market, with great impact on total investment profitability
#4 Even worse, we can stop investing, and we lose a lot of money!
In the previous article, we addressed the question of what it is and what it is to do the market timing, and the value of it to the investor.
We showed that market timing has high costs for the average investor in terms of loss of profitability.
In this article we will focus on the impossibility of market timing and reinforce the idea that the losses may still be higher than those explained in that article and documented in the studies referenced.
#3 We may lose some of the best daily returns on the market, with great impact on total investment profitability
Investors lose money because they do not realize that it is very difficult, if not even impossible, to make up the “timing” of the market, and these attempts cost dearly.
In fact, the evolution of the stock market is very unpredictable and very random, in which the best moments – days, weeks, months or years – come together and overlap with the worst.
To this extent, yesterday’s prices are independent of those of today or tomorrow, which calls into question the rationality of market timing.
In the following chart we see the cost of not being invested in the best days of the market between 1999 and 2020, as well as the volatility of daily returns:
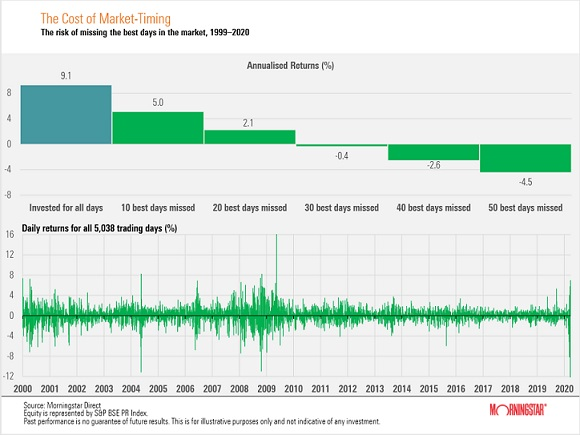
The miss of the best 10 days of each year on the market implies moving from the average annual returns of the S&P 500 in this period from 9.1% to 5%, i.e. equivalent to -4.1% per year.
If we miss the top 20 days, the average annual returns will drop to 2.1%.
And if 30 days are missed, the average annual returns fall to negative ground of -0.4%.
Looking at the low part of the chart, it can be seen that daily returns fluctuate between positive and negative at each instant.
These losses result in the following amounts when assessed in terms of invested capital:
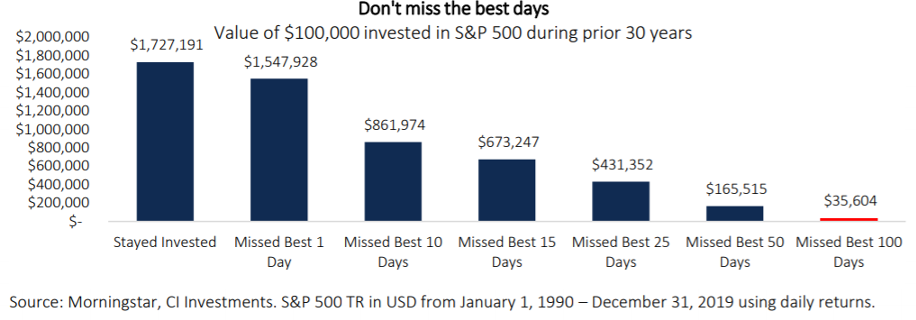
The investment of a capital of 100,000 between 1990 and 2019 would have resulted in 1.7 million if we were invested throughout the period.
The miss of the best day of the year would bring this capital to 1.5 million, and that of the top ten days to 860,000.
And we had missed the 25 best days a year (less than 1 month), the capital would be 430,000 euros, less than 1/3 of the obtained keeping the investment.
The following chart shows the average annual returns of the S&P and those that would be achieved if we lost the best month of the year between 1990 and 2019:
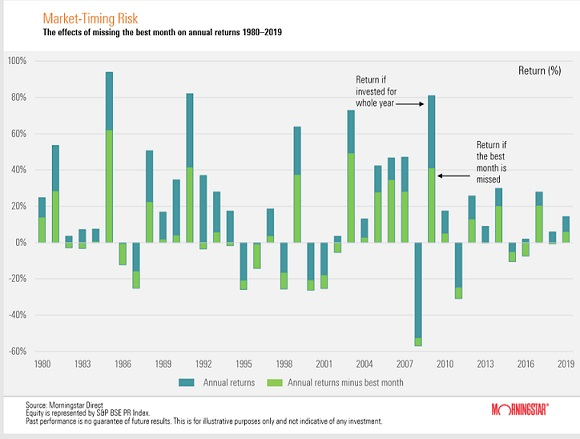
In many years, missing the best month of the year would result in losing between a third and half of annual returns.
The following graph illustrates what can happen to us if instead of being invested we try to do the timing of the market.
For an invested capital of 100,000 we simulate the situation in which we deinvest everything and move to liquidity at the market bottom, returning to the market 1 year later, between 2000 and April 2020 (peak of the pandemic crisis):
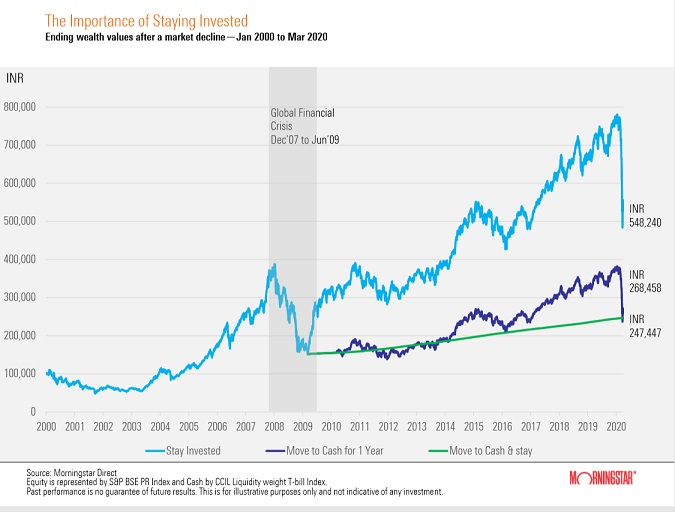
If we had remained invested throughout the period we would have accumulated a capital of 548,000.
If we had invested for a year our capital would be 268,000, that is, less than half.
If, alternatively, we had disinvested we would have a capital of 247,000.
Recoveries of major stock market corrections occur in the first few months or years.
The worst part is waiting forever or being late.
Even if you can get out soon and minimize the loss when the correction starts, it is very likely that a lot will be lost in the delay for re-entry into the market.
Moreover, if we get it right at least once, our speculator ego is fed, overriding the investor attitude, which increases the likelihood of future losses.
#4 Even worse, we can stop investing, and we lose a lot of money!
Worse still will be the scenario where normal stock market fluctuations can lead us to turn our backs on the market forever.
This situation is more frequent than is thought with many investors.
In fact, there are many people who do not invest in the stock market because they are not able to face these fluctuations.
The following chart shows the evolution of the S&P 500 between 1870 and 2020:
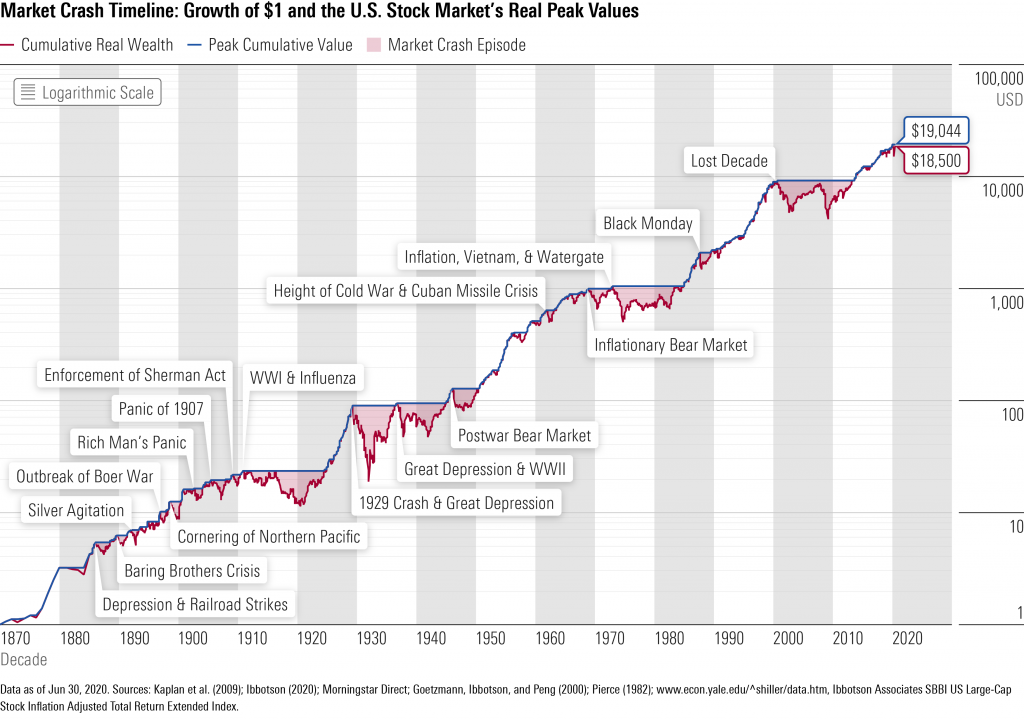
This chart shows well that in the medium and long term the stock market is always valued.
There are periods when the market falls, has negative fluctuations or more or less marked corrections, or even crises, as those indicated.
We have wars, plagues, economic depressions, that is, extreme and extraordinary events that result in deep crises.
But the stock market always recovers. Sooner or later, the market will rise again and surpass previous highs.
And average returns are 10% per year in the medium and long term, which is quite interesting and has a huge impact on the growth of our financial assets:
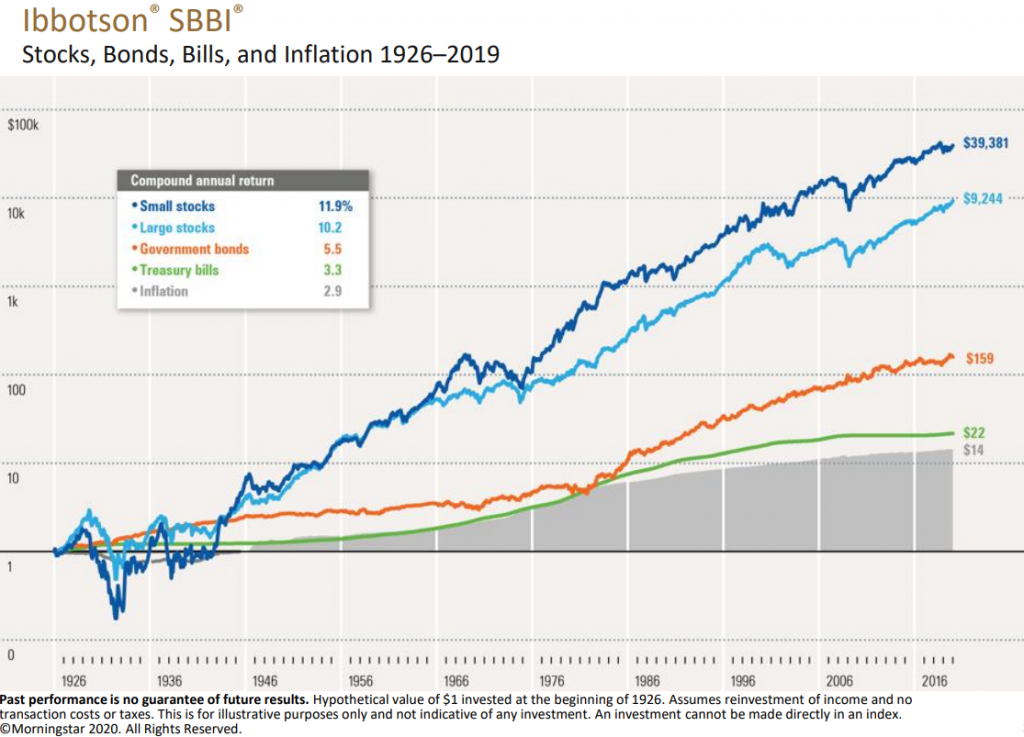
The difference in capital gains of the stock investment from bonds or treasury securities (or term deposits) is substantial.
This reality is true for the USA and for most developed countries.
In a previous article we addressed the theme of the annual returns of investment in stocks, comparing it with those of bonds and cash.
In another article, we also looked at the risks of investing in stocks, comparing them with those other investments.
Returns and risks give us a good perspective on the value and interest of investing in stocks.
In this way, what we have to do is maximize the time invested in the market, rather than being looking to get it right in the market times.
We have to accept that investing is a process and that there is a set of rules that we must follow in order to be successful.
It is a process that should be guided by an alignment with our financial objectives and with our risk profile.
It should also observe correct diversification and translate into an adequate and consistent asset allocation.
This is where we move on to the best and most appropriate selection of investments.
In the background, trying to do market timing, such as stock picking, is like looking at the trees without seeing the forest!


