


The day-to-day life of the stock market is lived like the weather
It is important to understand the biorhythm of the market and where the real gains are
The stock market has many fluctuations in the short term, and some corrections in the same year
The market has positive and negative cycles, which include technical corrections and bear markets
In previous articles we have analyzed what is the “market timing” or the choice of moments to be invested in the market.
We have seen the temptations to do so, the vices and the pitfalls.
Then we saw the costs and losses of doing the market timing.
We conclude that the costs and losses for investors of trying to pursue market timing are many and large.
In this article, which given its length is divided into two parts, we will see that it is impossible and therefore useless to try “market timing”, which reinforces the idea that it constitutes an effective waste of time and money (of investment in the market).
Markets fluctuate and are volatile.
They have cycles, positive and negative.
Some shorter and others longer, usually associated with economic conditions.
But these cycles are very difficult to anticipate and explore.
And the markets always recover and in the long run have a very interesting profitability.
In this first part we will analyze the functioning of the stock market, its evolution and the development of its cycles.
In the subsequent article that will make the second part, we will see that despite all these oscillations, the market always ends up to revert to the average.
But it is not a zero average, it is an average of progression, and very positive, which makes the investment very attractive.
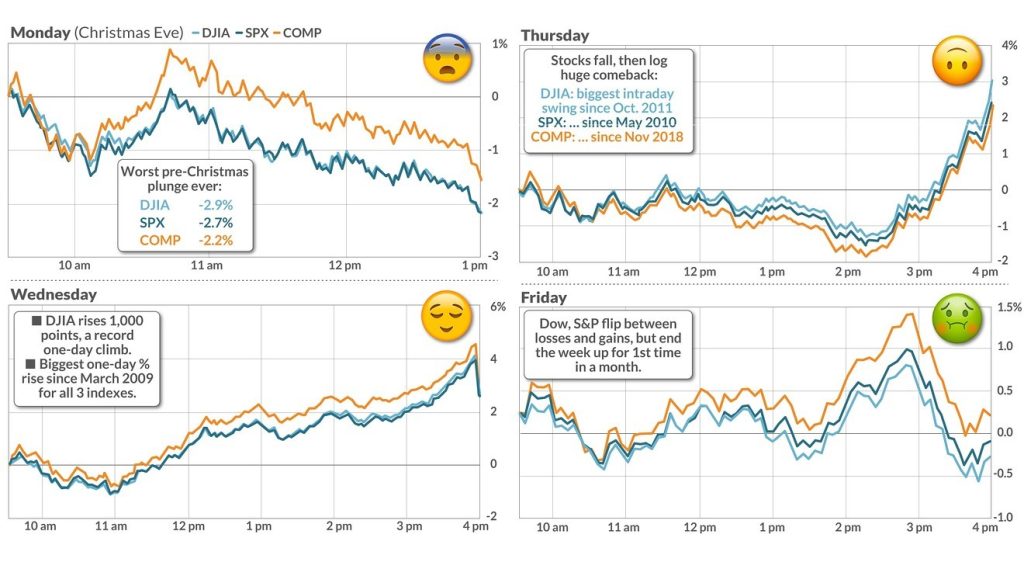
The day-to-day life of the markets is lived like the weather
As in meteorology, in the markets there are better days and worse ones.
We know how they start, but never how they end.
And there are days that seem to be good but end badly, and others that start badly but end well.
It is very difficult to predict the daily behavior of the markets.
So it’s not worth doing. We gain nothing but worries and anxiety. We just lost, especially confidence and time.
This is the attitude we must have as investors.
The day-to-day is for speculators or gamblers.
Investing is a medium and long-term process, with well-defined rules.
It is important to understand the biorhythm of the market and where the real gains are
As investors, it is important to keep in mind the biorhythm of the markets in order to resist making impulsive decisions that only harm us.
The following chart shows the biweekly returns of the U.S. stock market between 1928 and 2020:
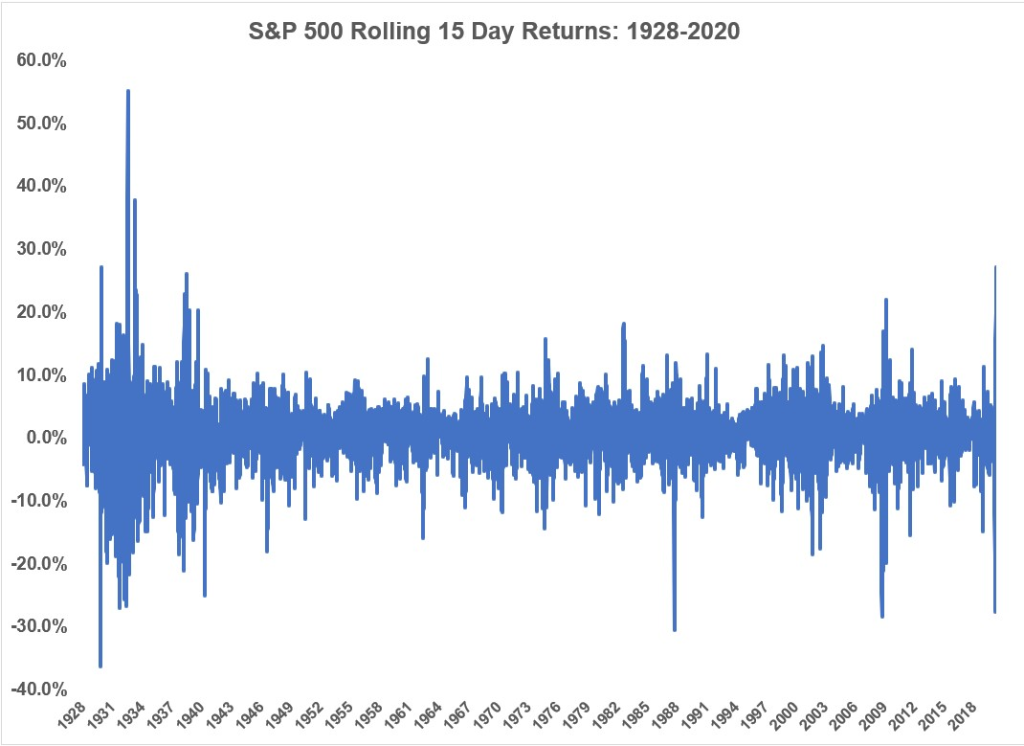
These returns work like an elevator, up and down.
The movement looks like a yo-yo.
This means that very short-term returns are very volatile. We have good and bad very much together, that is, very much followed. They are unpredictable.
This type of charts helps us to put into perspective the dynamics of the stock market.
The true value of investing in stocks is certainly not in the short term.
Daily market fluctuations up and down are frequent and normal.
The following graph shows this reality well, showing the distribution of the daily variations of the North American stock market, in which each point represents one day, of the last between 2011 and August 2021:
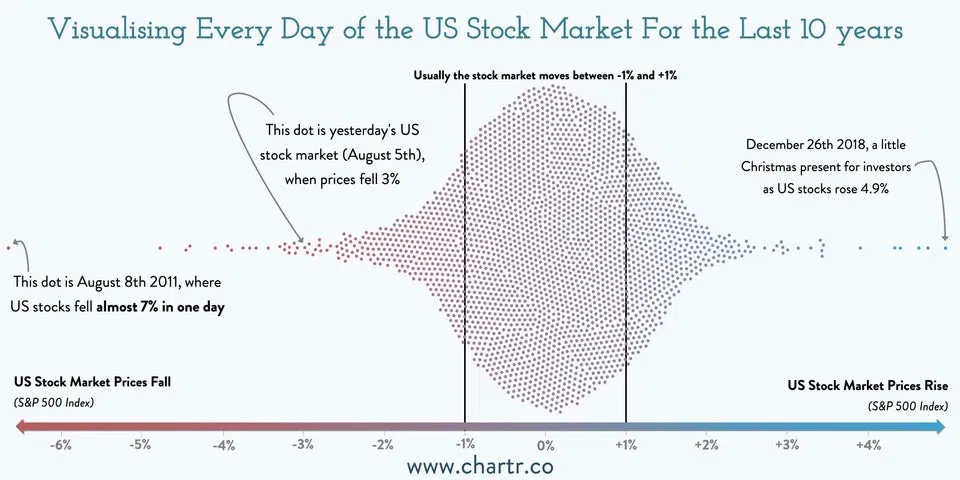
Most of the daily changes are between -1% and +1% (note: it is also clearly seen that there are more positive days than negative ones, in line with the annual profitability of the market above 10% in this period)
The following chart is another good example to see that daily fluctuations don’t matter:
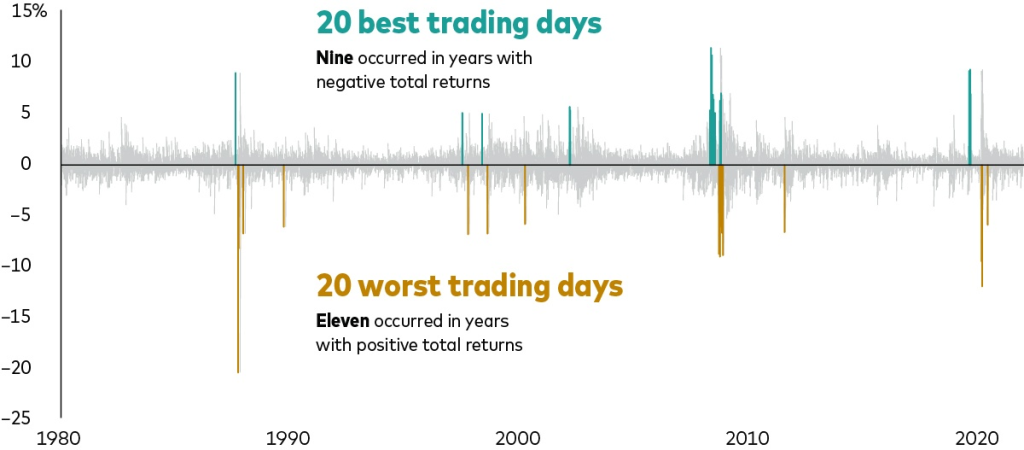
The days of the best daily returns follow or are glued to the days of the worst, relative to the North American market between 1980 and 2021.
This is the best proof of an important characteristic of the functioning of the market, which is its excesses.
The movements, positive and negative, are amplified (the so-called “overshooting”).
This happens because there are many agents who fall into the lure of acting in the short term, chasing after profitability.
They trade as if there is no tomorrow.
They buy as it goes up a lot, hoping that the rise will continue in the following days, and sell when it goes down a lot, thinking that the following days will continue badly.
As we said, they are speculators and investors
The stock market has many fluctuations in the short term, and some corrections in the same year
But this is not just for every day.
There are agents who speculate for the week, month, or any other short period, thinking that they get it right at the best times, which is not possible.
The following chart shows the annual returns of the S&P 500 along with the largest declines or devaluations in each of the years between 1980 and 2022, and is also very important to prove that it is impossible to anticipate the good times of the market:
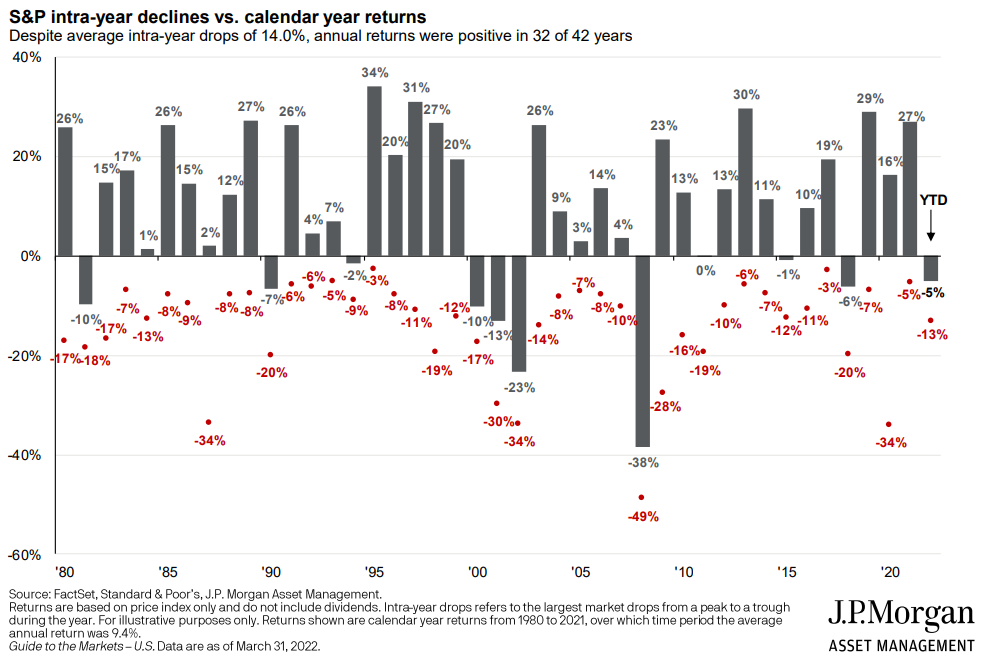
The incarnate values show the largest falls that occurred in each of the years.
In almost every year there are falls of 10% or more, in some cases up to 20%, but in most of them the market recovers and ends up positive (it only ended negative in 10 of the 31 years).
These negative fluctuations, also called technical corrections, are normal.
Investors should expect these intra-annual variations in the same way as daily fluctuations.
The market has positive and negative cycles, which include corrections and bear markets
We also have the negative market cycles, more spaced out, in which the corrections are greater than 20%.
In previous articles we have already delved into the topic of technical market corrections – between 10% and 20% – and even the biggest corrections, crises or “bear markets”.
Thus, here we address only the main idea.
The following chart shows the S&P 500 corrections of more than 10% that occurred from WW2 to the pandemic crisis:
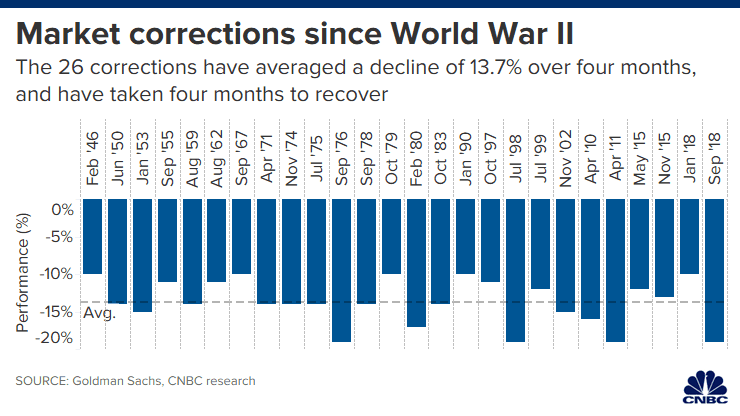
There are 26 corrections in all, in 72 years. The average loss was 13.7% and lasted 4 months. The recovery time was also 4 months. Above 20% we only had 4 situations.
We know how to explain the corrections after they have happened.
But the truth is that it is impossible to anticipate these corrections.
A lot of time is wasted trying to do it.
And especially money.
Corrections are only so violent because of the excesses committed.
In euphoria, one buys at any price, and in desperation, one sells at any price.
Again, because of this, the movements are amplified.
The positive conclusion is that the market recovers from these crises and cancels out these losses, usually in short terms.
Statisticians and technical analysts, among others, use a type of market indicator to illustrate this reality, which is volatility.
The main indicator of volatility in the North American market is the VIX index.
The volatility chart or VIX index (evolution of the standard deviation of monthly returns) for the S&P 500 index since 1928 highlights the difficulty of anticipating the market:
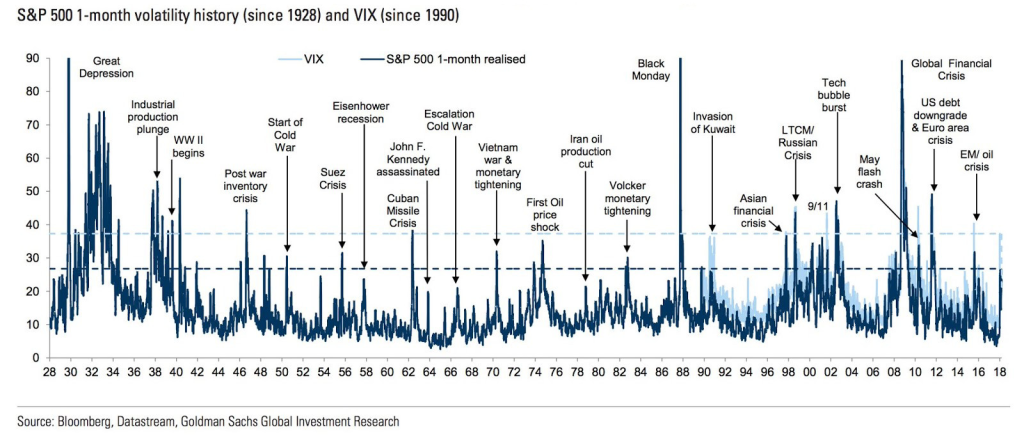
The VIX does not show a pattern. The monthly VIX evolves quite widely, which reflects volatility.
When the VIX rises above the value of 30 we experience the big corrections, or the “bear markets”.
Finally, it is worth seeing the duration and depth of large cycles or long cycles.
The following chart shows the performance of the positive and negative cycles of the S&P 500 (“bear and bull markets”) between 1926 and 2020:
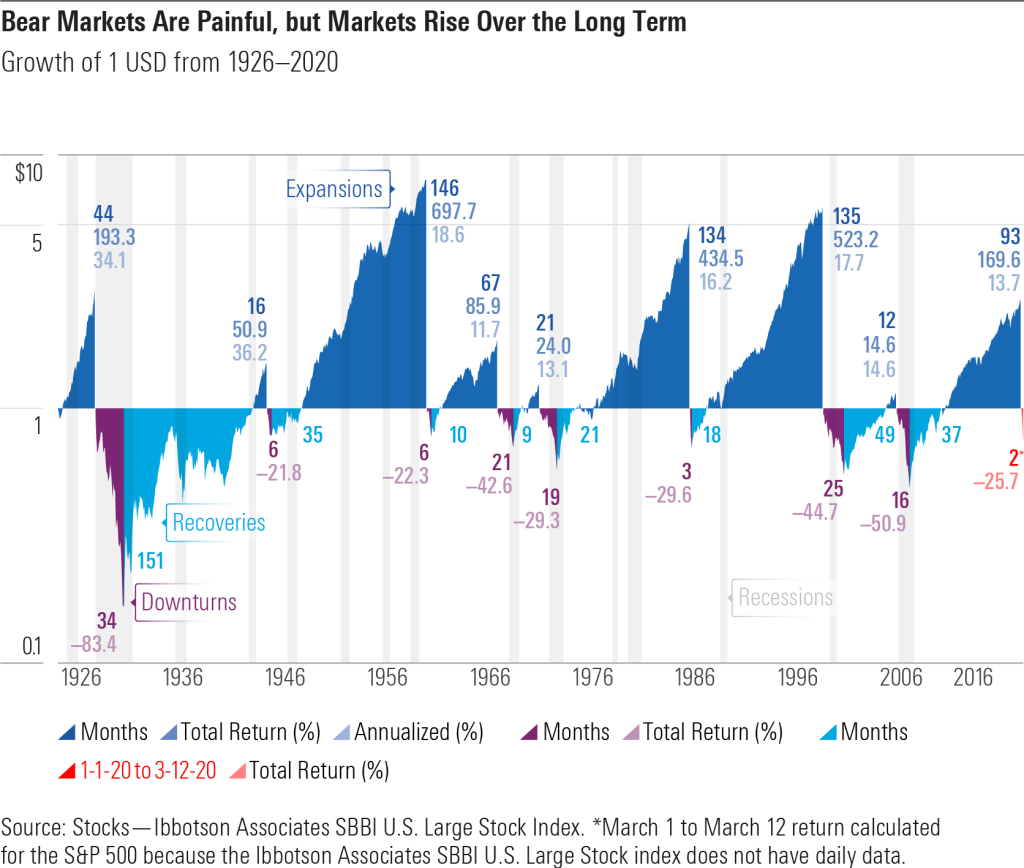
The evidence that expansions overlap contractions is clear.
Positive cycles are much longer and above all have much higher variations than negative cycles.
It is true that it is hard to go through the negative cycles and lose about 50%, as has already happened.
But then come the positive cycles with valuations of more than 200% to 500%, that is, 4 to 10 times more.
After a storm comes a calm.
For all this we say that when we think about the operation and investment in the stock market, not everything is as good as one thinks, nor as bad as it seems. There are always negative and positive forces and factors.
In the end, the market provides annual returns of 10% in the long run, as the history of the market since 1926 shows us.
This is the main indicator that we must pay attention to when we make our investments.


