There are 4 major financial asset classes relevant to investments: cash, stocks, bonds and alternatives (recall)
Bonds are debt securities issued by governments or companies
The main bond markets and their indices
The concept of bonds credit rating or credit risk notation
Bonds provide periodic income, stability and preservation to investment portfolios
What explains the evolution of bonds prices?
There are 4 major financial asset classes relevant to investments: cash, stocks, bonds and alternatives
The three most important asset classes are stocks, bonds and cash. Alternatives is the fourth.
Stocks have 2 main subclasses arising from the degree of economic or financial market development (emerging and developed) plus other 3 associated with the companies size (large, medium and small).
Bonds have 3 main subclasses arising from the combination of geography with degree of economic development (domestic, international and emerging markets), plus 2 from the nature or type of debtor (government or company) and another 2 from the level or quality of the risk of credit (investment or speculation).
Cash includes deposits, checking and savings accounts, and currency.
Alternatives include the subclasses of real estate, commodities, gold, hedge funds and private equity.
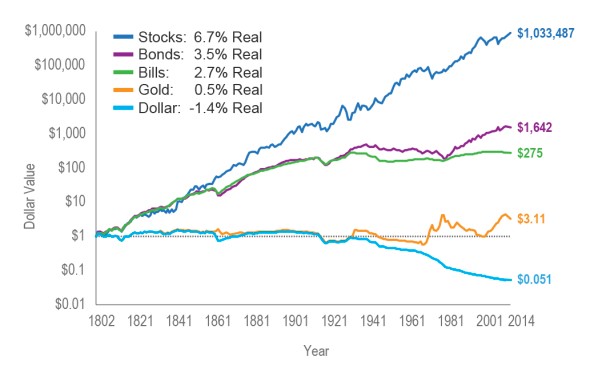
The real rate of return (deduced from inflation) of the investment in shares of large companies and 10-year Treasury bonds in the US, for the period between 1802 and 2014, was as follows:
Source: The Future for Investors, Jeremy Siegel (2005) with updates to 2014
Bonds are debt securities issued by governments or companies
Bonds are securities representing debt or loans from governments or companies for a specified period. During their life they pay a periodic income in the form of interest and at the end of their life they reimburse the capital borrowed.
Usually the interest payment is defined by a fixed interest rate (although there are also variable rate bonds), and is paid semi-annually.
There are several types of bonds, according to the issuer or debtor:
- Treasury bonds, considered the safest (due to the ability of governments to increase tax revenues to pay their debts). In this group we can have:
-Treasury bills: with maturities up to 12 months;
-Treasury bonds (the flat rate): issued with maturities that can go from 2 to more than 100 years but mainly for 10 years;
-Treasury bonds with variable rate: the variable interest rate is indexed at the interbank market rate (Libor, Euribor, etc.) plus a margin or “spread” of credit risk, and are normally issued for maturities between 3 and 10 years;
-Treasury bonds indexed to inflation (TIPS): The interest rate is indexed to the inflation rate;
- Bonds of government agencies: agencies that perform for-government functions of an economic or social nature and therefore benefit in many cases from the guarantee of governments;
- Bonds of regional or local governments: issued by regional government administrative bodies that have some capacity to capture taxes at regional level or have the central government’s guarantee;
- Corporate bonds: issued by companies.
We may also classify bonds as domestic and international.
The main bond markets and their indices
There are some bonds indexes used in portfolio management and performance evaluation, equivalents to the S&P 500 or the Eurostoxx 50 for the stock market.
These indexes can be classified according to their characteristics in terms of the type of issuer (Treasury bonds, municipal bonds, and corporate bonds), term to maturity (short, medium and long) and their credit rating (investment or speculative grade).
There are a multitude of bond indices. One of the best known is the Bloomberg Barclays Global Aggregate index which is a representative generic index of the investment quality rating emissions from that of developed countries.
There are a multitude of bond indexes. One of the best known is the Bloomberg Barclays Global Aggregate Index which is a representative generic index of the investment grade rating bond issues of developed countries.
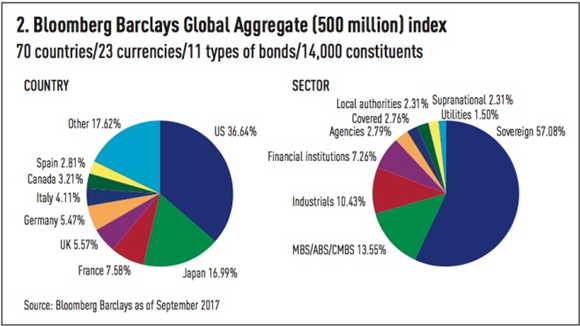
The U.S. represents 36.6%, followed by Japan with 17% and some European countries with between 5% and 7% each. Most of the bond issues are from governments (or sovereign debt) with 57%, mortgage or collateralized by other assets with 13.5%, from industrial companies with 10.4%, etc.
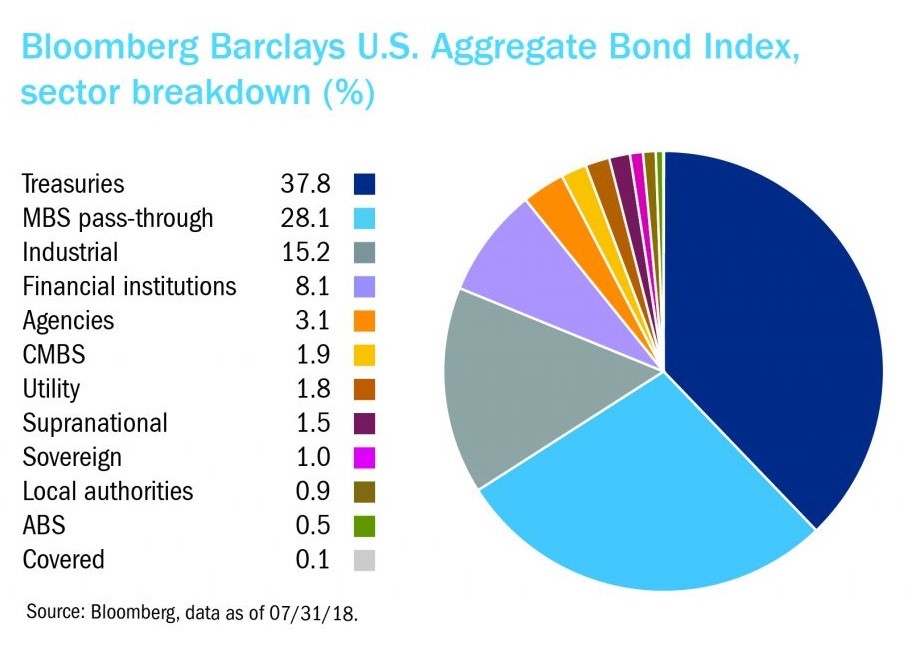
The equivalent for the US market only is the Barclays US Aggregate Bond Index, also representative of the issues of investment grade rating:
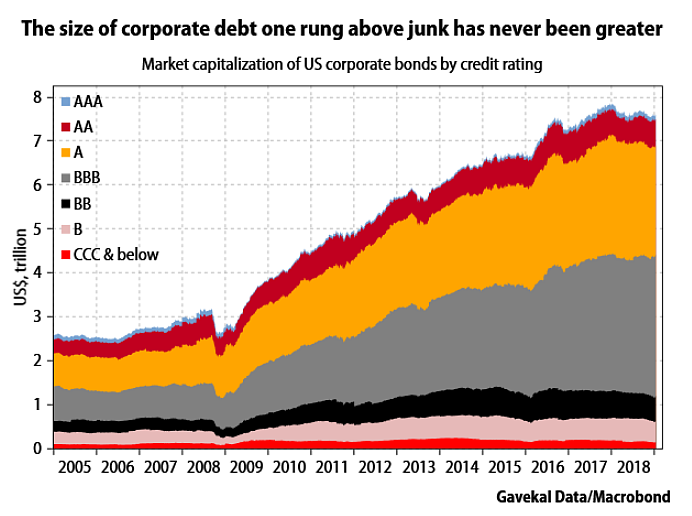
The two entities most commonly used in the development and maintenance of indexes of bonds are Bloomberg Barclays and the FTSE, whose main indexes can be seen in the following links:
https://www.bloomberg.com/professional/product/indices/bloomberg-barclays-indices/#/
https://www.yieldbook.com/f/m/pdf/ftse_indexes/FTSE-Fixed-Income-Indexes-Guide-20181001.pdf
Bond indexes are much harder to replicate than stocks indexes by the fact that they are composed of a large number of issues, and there are no two equal issues.
In another article we’ll discuss some of these indexes in more detail.
The concept of bonds credit rating or credit risk notation
The previous graph showed the breakdown of debt market companies in the US by credit rating. So what is rating?
The rating is a credit risk valuation notation attributed to issuers and issues by specialised agencies, of which the best known worldwide are Moody’s, Standard & Poor’s and Fitch.
The rating is assigned on a scale of risk levels ranging from Aaa or AAA (best risk) to D or DDD (default), depending on the likelihood of payment of the debt service:
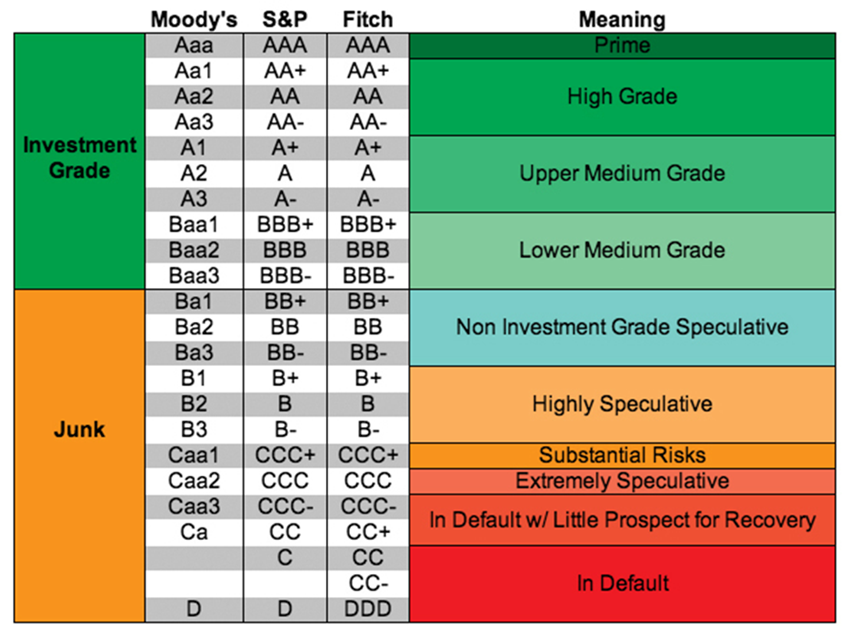
There are two major “rating” categories: investment grade (or quality) or speculative grade (or junk).
Any bond issue can be the subject to rating or not.
In other articles we will cover the subject of credit rating in more detail.
Bonds provide periodic income, stability and preservation to investment portfolios
Bonds provide net worth stability and preservation arising from two benefits to investors in a diversified investment portfolio: a source of income paid regularly (the interest coupons) and the mitigation of the volatility that comes from holding shares.
The graph shows the (24) annual periods in which stocks had negative returns in the last 90 years, between 1926 and 2016:

Source: Fidelity Capital Markets, Investment Themes 2017
In years of stocks losses, bonds had a positive performance. Thus, bonds are a good safe haven and serve as a cushion in times of stress in the markets.
The following chart shows the evolution of an investment of 100.000 in the S&P 500 and Barclays Aggregate indexes for the last 25 years:
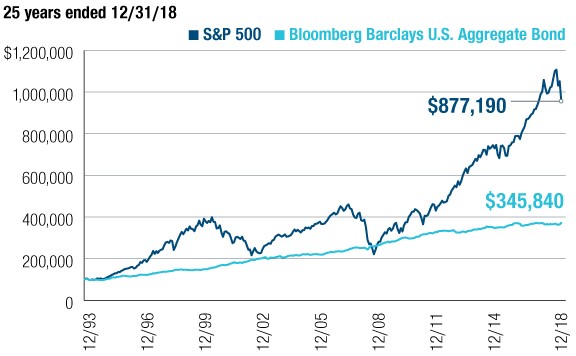
The capital gain of the investment in the stock market is much higher, given by the difference between the Capitals accumulated at the end of $877.190 for the stocks and $345.840 for the bonds, but the risk is higher in the first case, as can be seen by the higher volatility versus stability of the evolution of the capitals in both situations.
What explains the evolution of the bonds’ prices?
A major component of the bond market is the market of government bonds, because of its size and liquidity. Government bonds are often used to compare to other securities and to measure credit risk.
Due to the inverse relationship between the value of the bonds and the level of interest rates to maturity (or yield-to-maturity), the bond market is used to indicate changes foreseen in interest rates or the shape of the yield curve, a measure of “financing costs”.
The yield of Treasury bonds in low-risk countries such as the United States or in Germany is taken as a reference to indicate an interest rate without credit risk. The remaining bonds denominated in the same currency (US dollars or Euros), normally have higher yields, in large part because the probability of their issuers to not being able to repay their debts is larger and the losses for investors in the event of failure are also higher.
The following chart shows the inverse relationship between interest rates and bond prices:
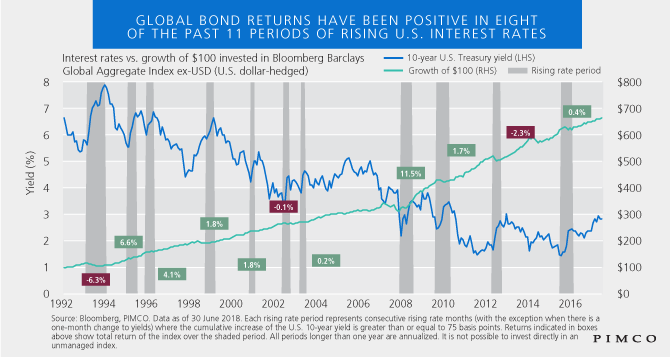
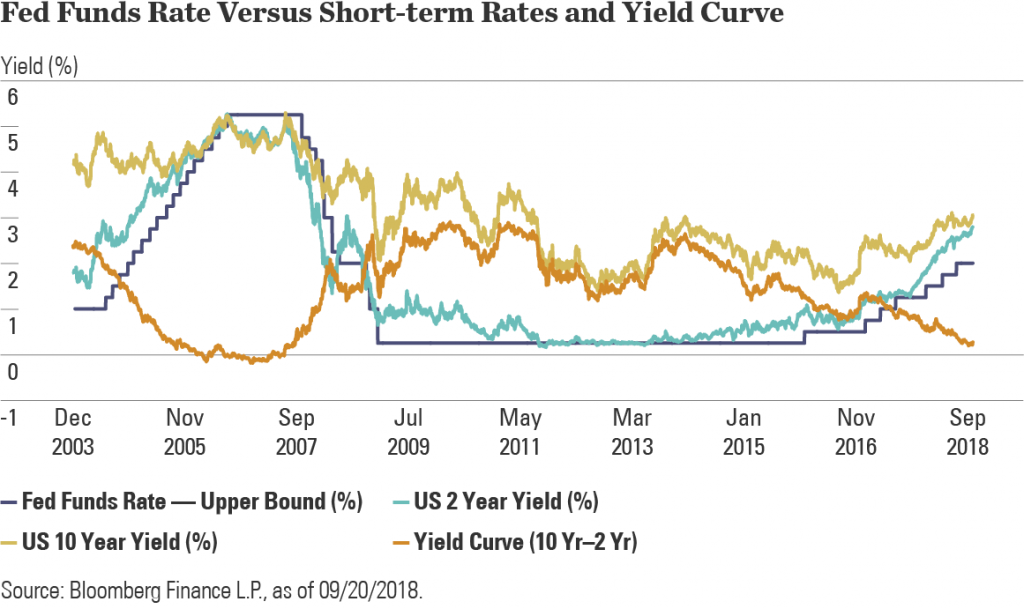
The evolution of the interest rates of the Treasury bonds is determined first by the level of the reference rate of the central banks:
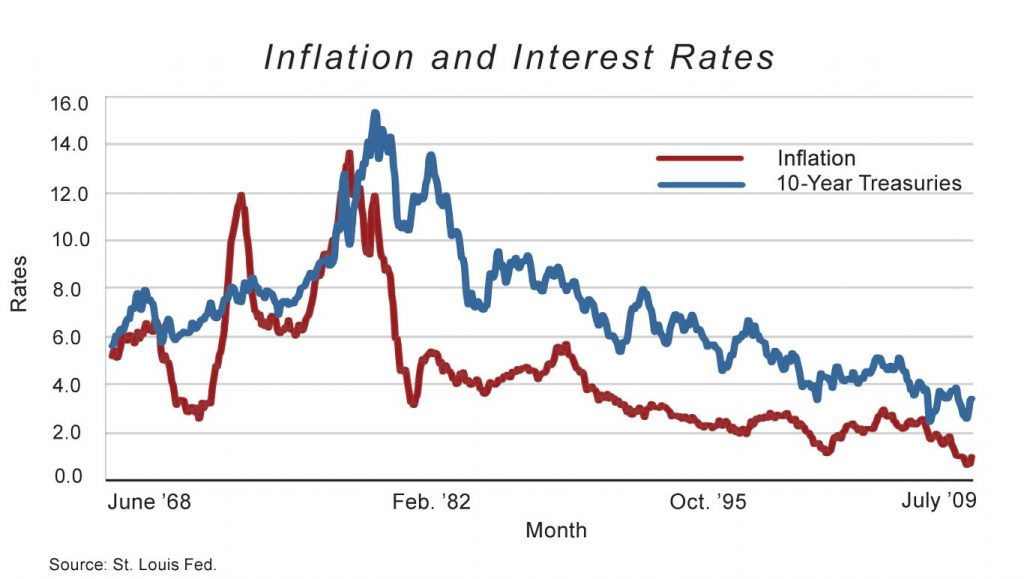
Secondly by the expected inflation rate:
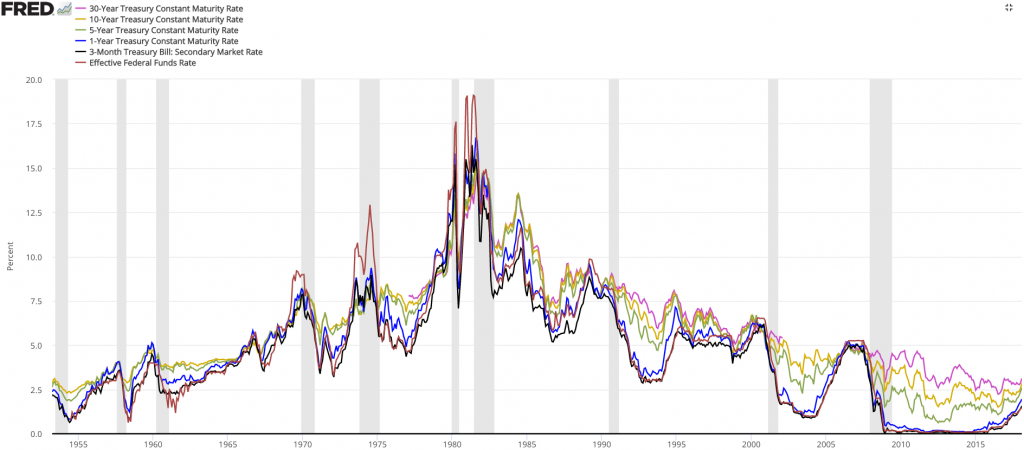
Then the longer the term, the greater the risk, because the greater the probability of default:
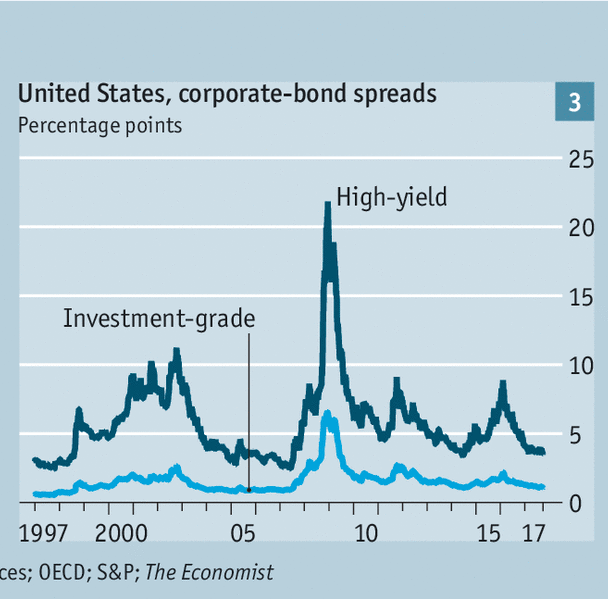
Lastly, the higher the credit risk the higher the interest rate or yield to maturity required by investors:
