


What are the 3 major financial asset classes: Stocks, Bonds and Cash
The average annualised rates of return and the investment monetary growth value of these assets in the United States (in nominal suits)
The average annualised rates of return and the investment real growth value of these assets in the United States (deducted by inflation and taxes)
The average rates of return of the 3 main return asset classes globally
The average returns of these assets by investment horizons or the by time periods (“rolling returns”)
What are the 3 major asset classes: Stocks, Bonds and Cash
There are three major financial asset classes: stocks, bonds and cash.
These classes are represented by multiple instruments and financial investments. Let’s see them as simple instruments (e.g. shares of large companies, the 10-year government bond and the 3-month Treasury bill) or groups of instruments (e.g. stock or bond markets indices).
These classes differ by their return and risk: it is obvious that the higher the return, the greater the risk.

The average annualised rates of return and the investment monetary growth value of these assets in the United States (in nominal suits)
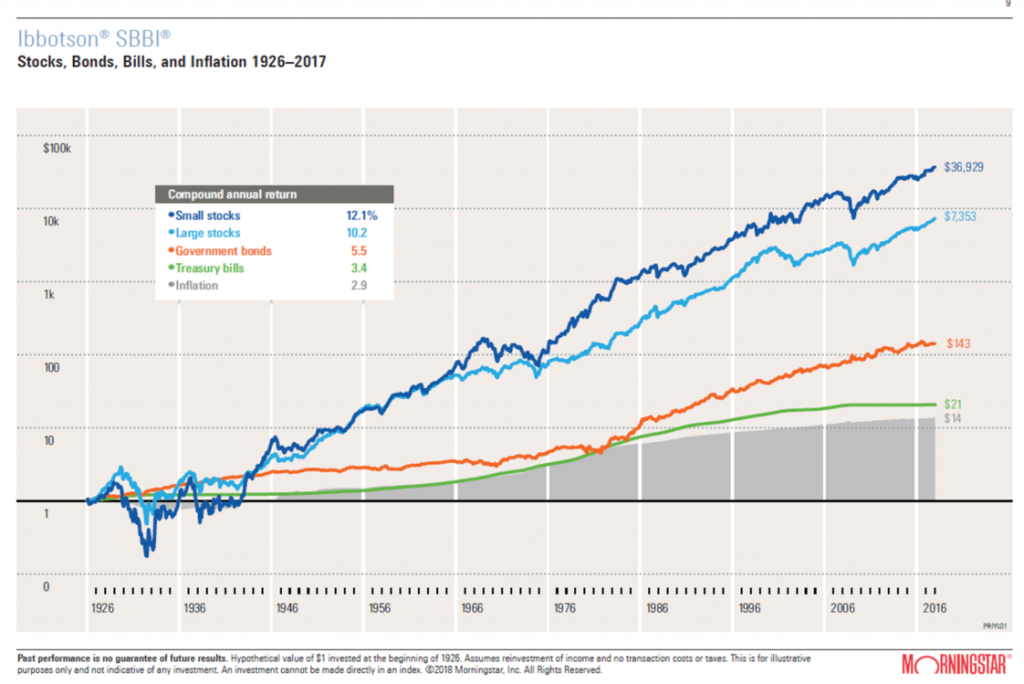
The graph shows the behaviour of the 3 classes of assets between 1926 and 2016 in monetary or nominal terms.
The shares of small/medium-sized and large companies have had annual average nominal returns of 12.1% and 10.0%, respectively. An investment of $1 made in 1926 was worth about of $33.212 and $6.035, in 2016, respectively.
The 10-year Treasury bonds and the 3 –month Treasury bill had annual average nominal returns of 5.5% and 3.4%, respectively. An investment of $1 made in 1926 was worth $134 and $21 in 2016, respectively.
Cash (or Treasury bills)) had a return of 0% and the average annual inflation in the period was 2.9%. So, $1 of 1926 is worth the same as $13 today, or a dollar today was worth just 7.7 cents 90 years ago.
The average annualised rates of return and the investment real growth value of these assets in the United States (deducted by inflation and taxes)
The graph shows the behaviour of the 3 classes of assets between 1926 and 2015 in real terms or effective purchasing power, adjusted by inflation and taxes.
Shares of large companies had average annual real returns of 6.7%, making an investment of $1 in 1926 worth $5.317 in 2015. If we additionally deduct taxes, the effective annual return would be 5.1% per year, and the current capital would be $80. The10-year Treasury bond had real average annual returns of 3.6%, making an investment of $1 in 1926 worth today about $135.
If we additionally deduct taxes the effective annual return would be 0.6% per year and the current capital would be $2, that is, only twice the amount invested 90 years before. Looks and is very little to wait for 3 generations of investment to double the value of the capital invested!
Although there is no data for cash, we can conclude that it is a bad or not even an investment: associated with the definition of investment is the idea of wealth building or growth, which is not the case.
Fonte: Morningstar, The Big, Bad Bite of Taxes and Inflation, 2016
In conclusion:
1) stocks provide high capital appreciation in the long term, i.e. 80 times in terms of actual purchasing power in 90 years;
2) the difference between the effective wealth growth of investing in stocks or bonds is about 40 times ($80 versus $2 only);
3) having to wait 90 years to double the value of capital invested in bonds is the price paid for being conservative or risk averse;
4) cash is or a bad investment or not even an investment (it is an asset of refuge and to pay for living expenses;
5) it can be seen that, although the performances evolution of any of these assets is not linear or constant, there is a clear trend line for both, which means that these conclusions are applicable to shorter investment periods.
The average rates of return of the 3 main return asset classes globally
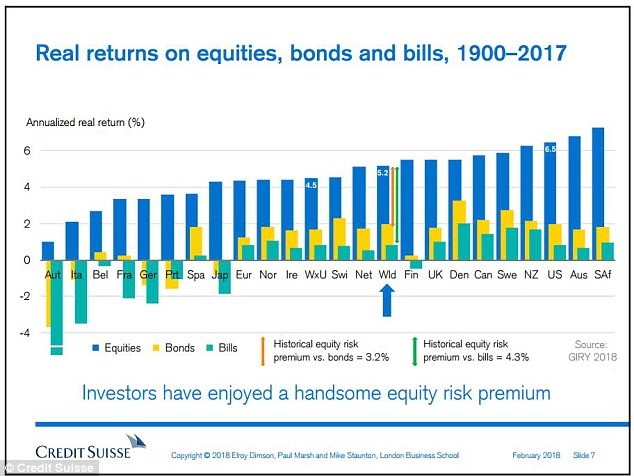
Contrary to what one may think, the real absolute and relative performances of these assets are not specific of the USA but apply also to other geographies. Stocks provide always a higher return than bonds and these are higher than those of Treasury bills.
Countries that have experienced the plague of major wars and the consequent periods of hyperinflation had obviously smaller returns in all classes, and even negative returns in bonds and Treasury bills.
Fonte: Triumph of the Optimists: 101 Years of Global Investment Returns, Elroy Dimson, Paul Marsh, & Mike Staunton, Princeton University Press
https://www.credit-suisse.com/about-us/en/reports-research/studies-publications.html
https://pages.stern.nyu.edu/~adamodar/New_Home_Page/datafile/histretSP.html
The average returns of these assets by investment horizons or the by time periods (“rolling returns”)
To have a better view and comparison of the stocks and bond performance over time, instead of looking at the accumulated average annual return or in a given period, is to see the returns obtained by investment periods, since we apply savings by time horizons. This measure is given by “rolling-returns”, or time moving average returns.
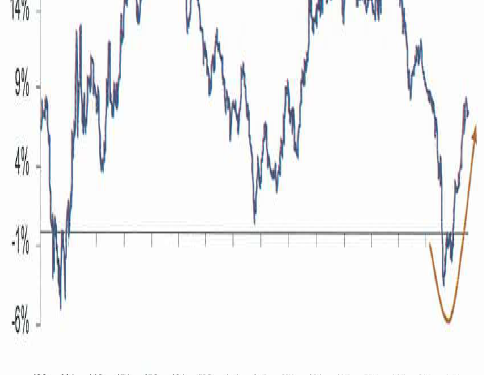
From 1936 until 2014 (almost 80 years), the investment returns on 10-year US Treasury bond for periods of 10 years ranged between 0% and 15% per year, with an average of about 5% per year.
Two periods clearly stand out: 1) from 1936 to 1982 with below average returns, between 0% and 5%; 2) of 1983 until 2014 with above average returns, between 5% and 15%, a very positive cycle that is associated to global political stability, the end of the gold standard and the growing role of monetary government policies. In recent years it has shown a clear trend of descent to the past returns.
In the same period, the investment returns in shares of the largest american companies for periods of 10 years ranged from -5% and 20% per year, with an average of about 10% per year. One can see clearly a pattern of very long cycles of stocks returns, estimated at “waves” of about 30 to 40 years. There were only two periods of negative returns, the years between 1938 to 1943 and from 2008 to 2010, associated with the great world wars and to two major financial crises in the world, respectively.
An even better way to see the compared assets returns in moving average terms (or rolling returns) is given by the difference between the two. From 1900 until 2014, the 10-year stocks rolling returns always beat the Government bonds and in some periods by many percentage points. The exception was the great depression of the 30 years and the technological bubble and great financial crisis of the new millennium.
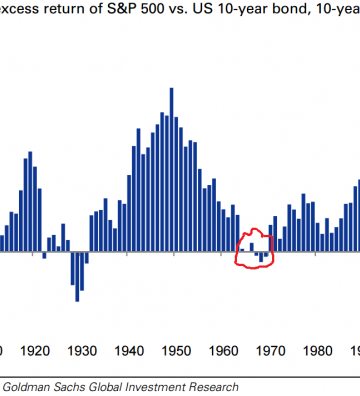
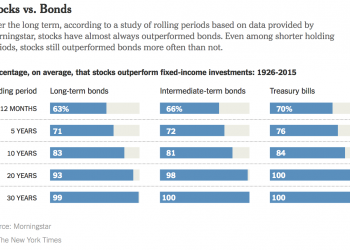
Finally, stocks returns were higher than bonds returns in 63% of the years, and in 71%, 83%, 93% and 99% of the periods of 5, 10, 20 and 30 years, respectively (for Treasury bills these percentages are even higher).


