The various costs of mutual funds
The average costs of mutual funds vary widely between categories, but more significantly between passive and active managed
The average costs of mutual funds also vary widely between countries being lower in the more developed and sophisticated countries
Although what matters to the investor is net returns, not gross returns or costs, there is a direct relationship between low costs and good performance
The funds costs may cost more than half the return on the capital invested
In previous articles in this series we begin by seeing the main features of mutual funds and the main types of funds.
In the preceding article of this series we addressed the profitability of mutual funds, as it is an important element in the investor’s decision on the choice of funds to invest in, right after the fund category or type.
We saw the average returns of the main fund categories, the dispersion of returns within each category, the low time consistency of returns and the Sharpe ratio as a measure of risk-adjusted profitability.
In this article we will address the issue of funds costs, which is the next factor in the selection of mutual funds.
We know that what matters to the investor is net returns.
However, as we shall see, there is a relationship between gross returns, but also the net returns of the funds and their costs.
This is quite evident in the main categories of funds and which relate to investments in efficient markets, such as higher capitalisations or investment quality bonds in developed markets.
And these costs are very different not only between categories and even within the same category of funds.
Thus, we conclude that, although what matters are net returbs, in general the individual investor is better off investing in lower cost funds.
This series is accompanied by the publication of articles containing information on the main investment funds of each category in the Best of Investment Funds Series in the Assets and Investments folder and a summary sheet of the information of the funds in the Tools folder.
The various costs of mutual funds
Mutual funds have various costs for investors.
We have management fees, custody or deposit fees, and transaction fees, which may include subscription and redemption fees (buy and sell on exchange-traded funds) and distribution or marketing fees.
The average costs of mutual funds vary widely between categories, but more significantly between passive and active managed
The average costs of mutual funds in the US for the various categories of funds are as follows:
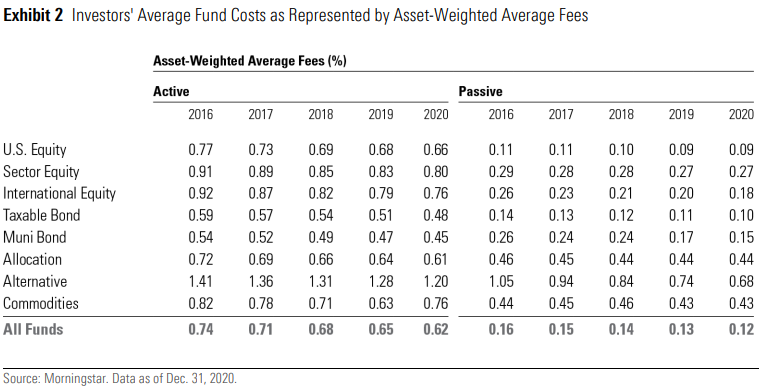
These costs have been falling since 2016 for all categories.
Secondly and more significantly, the costs of passive funds are substantially lower than those of active funds in any category.
For example, these costs are 0.09% in passive Funds of US stocks that compared with 0.66% of their active funds.
In the case of bond funds the situation is similar at a cost of 0.10% for passive funds of taxable bonds compared to 0.48% of the active counterparts.
There are of course cost differences of funds between categories that represent different asset classes.
Bond funds have lower costs than stock funds, just as alternatives have higher costs than the latter.
The higher the expected return, the higher the cost.
And the higher the cost of analysis, specialization or niche market also the higher the cost.
The average costs of mutual funds in Europe for the various categories of funds are as follows:
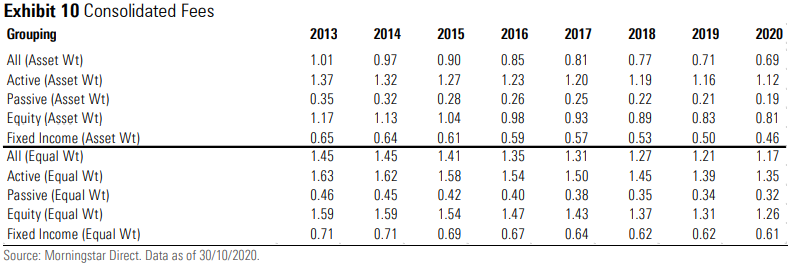
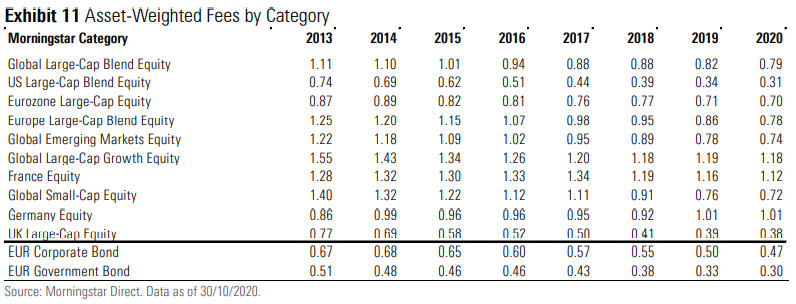
The situation is the same as in the US, i.e. lower costs in the period under review for all categories and passive funds cheaper than comparable assets.
The average costs of all asset-weighted equity funds are 0.81% while those of passive funds (where equity funds account for more than 90%) have an average cost of 0.19% in 2020.
The average costs of mutual funds also vary widely between countries being lower in the more developed and sophisticated countries
The average costs of equities mutual funds traded in the main countries of the world are as follows:
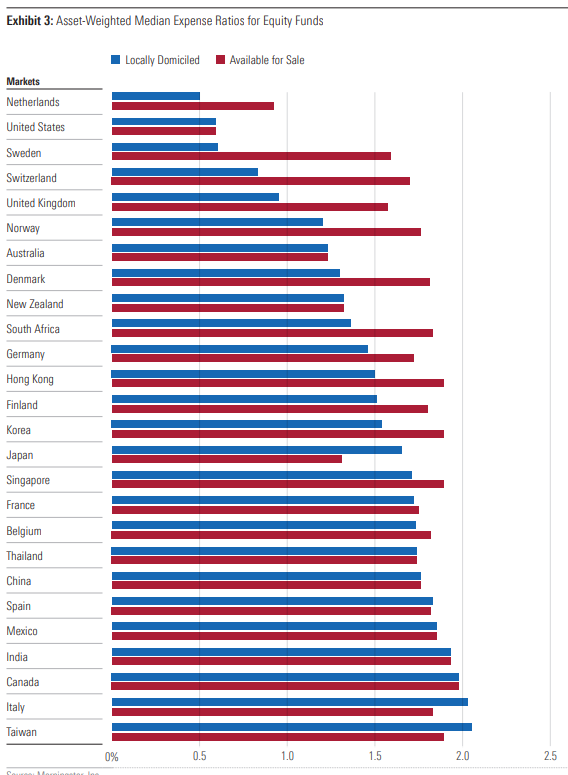
It was concluded that the differences in commissions very significant between countries, ranging from 0.6% in the US to almost 2% in Italy.
In fact, the more developed, sophisticated or demanding the market, the lower the cost of funds.
Although what matters to the investor is net returns, not gross funds or costs, there is a direct relationship between low costs and good profitability performance
For investors, what matters is not the gross return on investment funds, but net returns, deducted from all associated costs.
The following graph shows the success rate of active management funds on passive funds, measured by the percentage of those funds exceeding their passive counterparts, for the US, by categories and for the periods of the last 1 to 20 years:
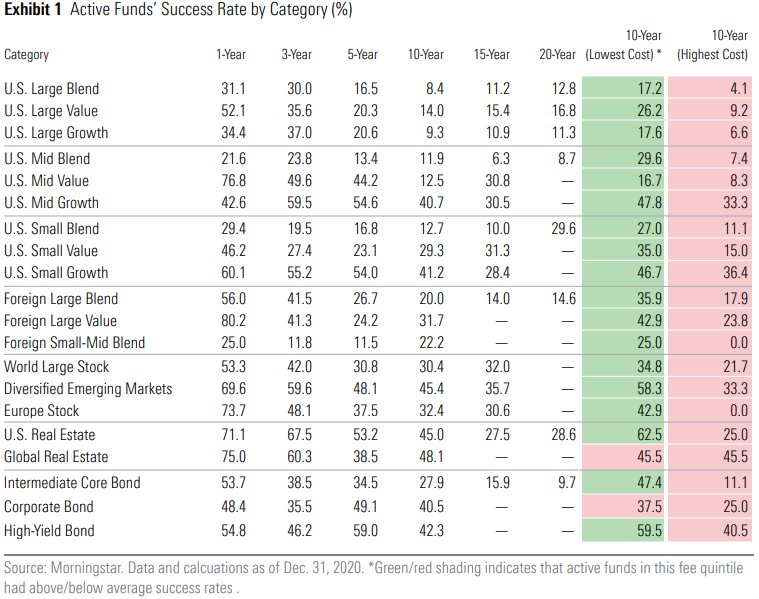
First, we see that the success rate of active funds relative to passive is very low mainly for longer periods, exceeding 10 years.
These are the periods that matter most not only because investment is a long-term process, but also because the longer the term the greater the impact on capital appreciation due to the compounding effect.
The success rate of large equities funds of US companies has been 8.4% in the last 10 years and 12.8% in the last 20 years.
In almost all categories of funds this success rate is less than 50%, which is worse than to toss a coin.
The success rate is the lower the more the efficiency of the market and vice versa.
In US small capitalization funds, the success rate of the last 10 years increases to 17%, in global equities funds to 30%, and in corporate bonds to 40%.
If we look at the two columns on the right, which show the success rates of the funds of the best and worst quartile of costs for the last 10 years, we realize that there is a direct relationship between costs and returns of the funds. That is, the higher the costs of the funds, the worse their net returns.
For example, again in the case of funds from large capitalisations of US companies the cheapest funds have a success rate of 17%.
This rate is four times more than that of 4% of the most expensive funds and double the average rate 8%.
The same conclusion can be drawn for any other category of funds.
The costs of the funds may cost more than half the return on the capital invested
The following graph shows the loss of capital associated with different annual percentage rates of mutual fund costs for an invested capital of 100,000 at an annual return rate of 6% for terms between 5 and 40 years:

To have an idea of the true cost of these commissions in the valuation of capital, we present in the following graph the quotient between the accumulated capital without and with the commissions:

The impact on the growth of invested capital can reach 50%, that is, we can spend capital only on commissions.
With commissions of 0.35% or even 0.5%, this cost measured in terms of the impact on the growth of invested capital is reasonable for the 20 to 30-year terms, but commissions of 1.5% to 2% are an exaggerated cost.


