For a complete and efficient diversification we must move from the 2 major asset classes – stocks and bonds – to their main sub-asset classes
From assets classes combinations to sub-asset classes combinations
To make a complete and efficient diversification is to optimize the investment portfolio expected return to a chosen level of risk by combining the main sub-asset classes
After deciding on the allocation between savings accounts and investments, and among the main classes of assets, Stocks and Bonds, it is worth going further to make a more complete efficient diversification.
The reasons are the same as before. On one hand, do not put all the eggs in the same basket, and on the other hand, the unpredictability of asset classes returns even in the short term.
The theoretical basis lies in optimizing the trade-off between expected return and risk, looking for combinations of subclasses that increase return for a given level of risk or vice versa (reduce the risk for a given return).
It is only worth extending and advancing diversification through the increase in combinations of asset subclasses to the extent that a significant improvement in the trade-off between return and risk is promoted.
When this does not happen, the additional complexity and costs associated with increasing subclasses do not compensate.
We can define multiple sub-asset classes according to multiple criteria. The main sub-asset classes, validated by theoretical studies of investment diversification and those most used by investment management professionals, are as follows:
- Stocks: geography (region or country) and the companies’ market capitalization or market size (small, medium and large);
- Bonds: geography (region or country), the nature or type of the issuer (governments or companies) and credit quality or credit risk rating (investment or speculative grade);
- Alternatives: real estate, commodities (or natural resources), gold, hedge funds and private equity.
This is the current and modern way of allocating assets in wealth management, which contrasts with the traditional model used until the 1990s.
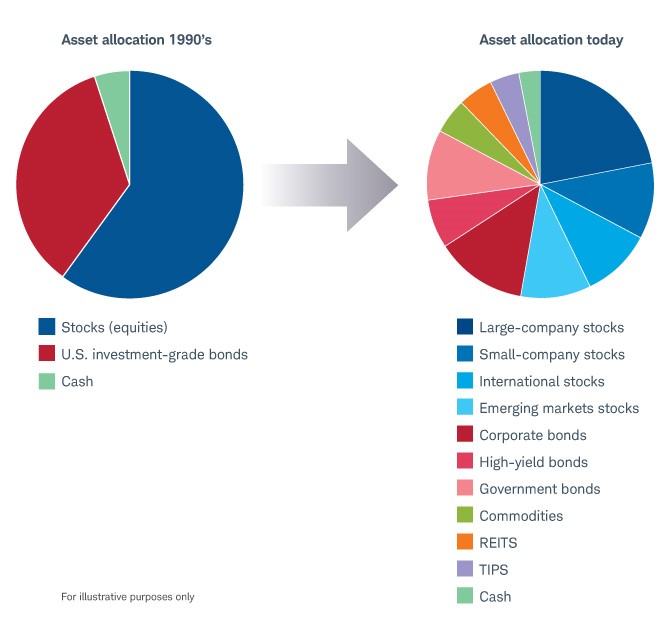
Source: Schwab Intelligent Portfolios™ Asset Allocation White Paper, Charles Schwab
It is impossible to predict the performance of assets classes and sub-asset classes even in the short term (reminder)
Savings or cash are very short-term placements with zero or even real-negative yields and with immediate liquidity.
Investments in stocks and bonds are investments for terms longer than 2 years and provide much higher average rates of return but they are subject to possible losses arising from market fluctuations.
The main stocks sub-asset classes are geography (region or country) and the companies’ size (small, medium and large).
The main bonds sub-asset classes are also geography (region or country), the nature or type and credit quality or credit rating of the issuer.
The chart below (also known as Callan Periodic Table of Investment Returns) highlights the annual performance of 9 of the main sub-asset classes over a 20-year period between 2000 and 2019, including: 4 stock market indexes, Large Cap Equity (S&P 500), Small Cap Equity (Russell 2000), Developed ex-US Equity (MSCI World ex-US), Emerging Market Equity (MSCI Emerging Markets); 3 bond market indexes, US Fixed Income (Barclays US Aggregate Bond Index), High Yield (Barclays US High Yield Index) and Global ex-US Fixed Income (Barclays Global Aggregate non-US Bond Index); Real Estate (Footsie EPRA); Cash Equivalents (3-month US Treasury bills).
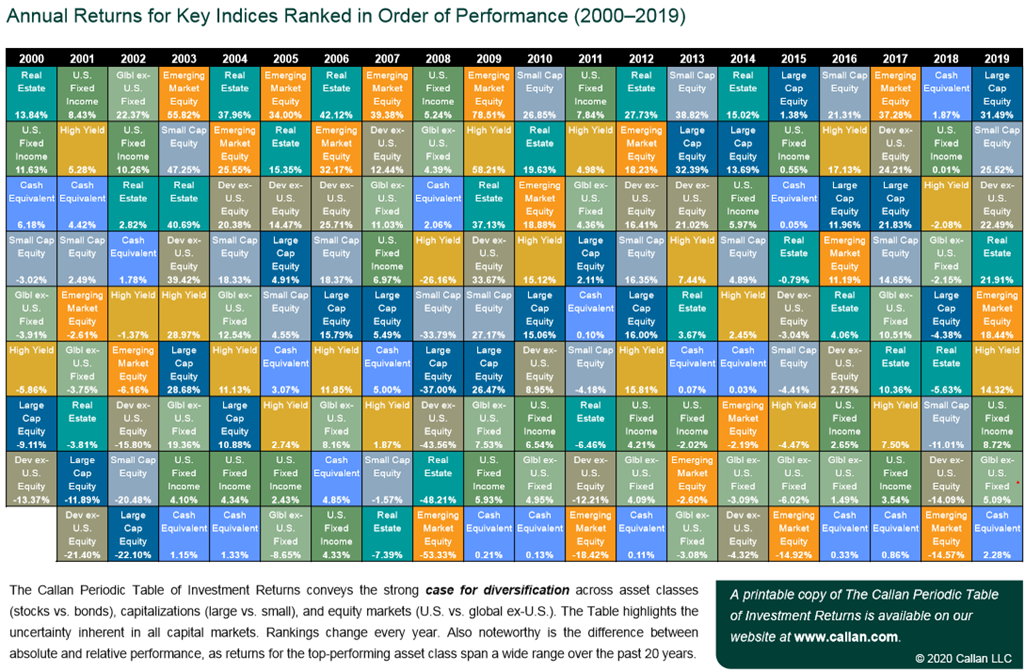
Assets with good performance in some years end up performing poorly in the following years: this is the effect of market cycles (periods of boom and “bust”); e.g. real estate, emerging markets, etc.
There isn’t a superior asset even in a short period of 17 years.
It is very difficult to predict the behaviour of asset classes even in the short term.
https://www.standard.com/eforms/13499.pdf
From assets classes combinations to sub-asset classes combinations
The first level of diversification is to allocate by the 2 large asset classes, choosing the combination of expected return and risk between stocks and bonds more appropriate to the investment term and the investor’s risk profile.
The following chart shows the combinations between shares (S&P 500) and bonds (U.S. government debt to 10 years) for the 40-year period between 1970 and 2017.
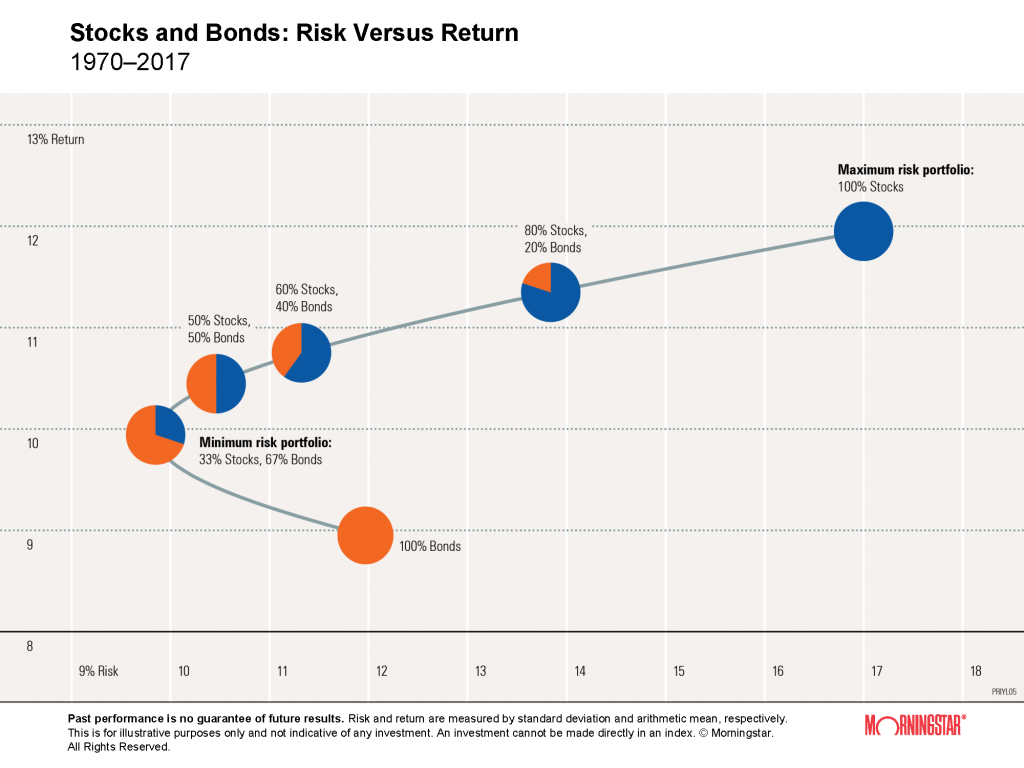
The second level of diversification is to do the same, but for the main sub-asset classes.
In general terms, the main asset classes and sub-asset classes are positioned as follows in terms of returns and risk.
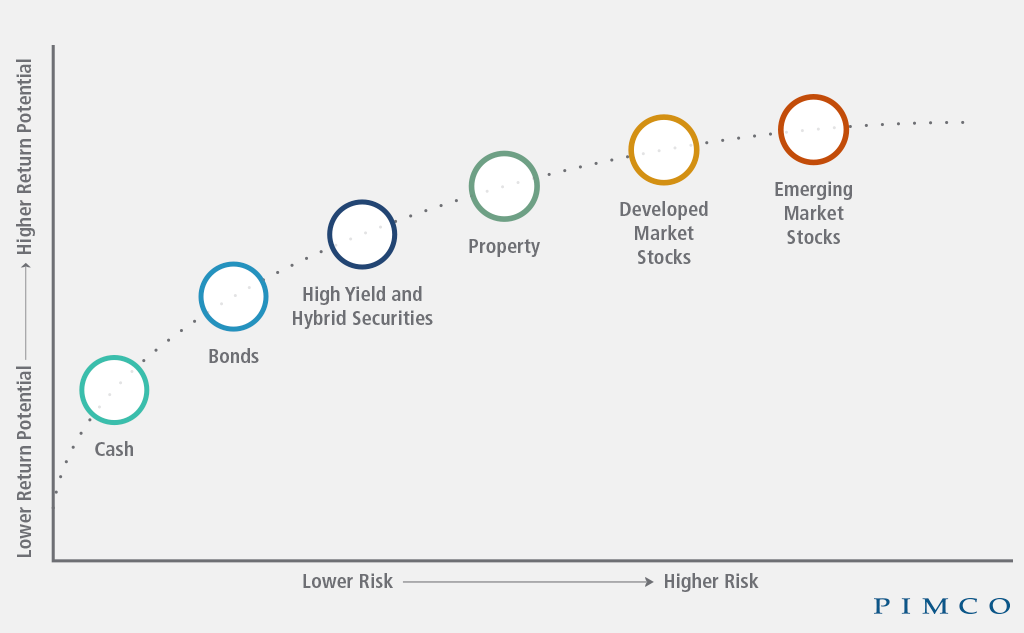
The following graph indicates the annualised returns and risk of each of the sub-asset classes represented for the 20-year period between 1998 and 2017.
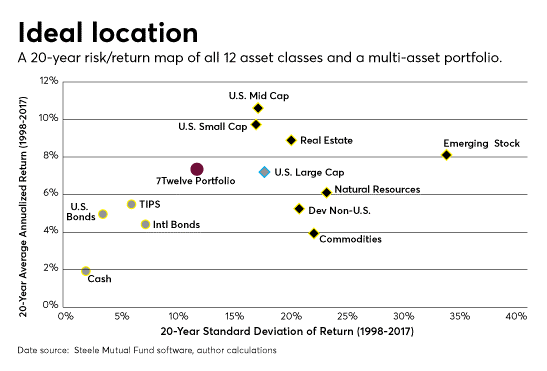
The combinations in the lower left corner of the chart, which have associated lower risk, consist mostly of bonds sub-asset classes, while those in the upper right corner, which is associated with the highest risk, are fundamentally stock sub-asset classes.


