Morningstar is the leading global mutual funds analysis and rating agency, which is widely used by institutional investors.
Morningstar covers 4,000 mutual funds, including 1,150 funds and 300 ETFs in the US, and 91% of funds traded in Europe.
This barometer is very interesting because we consider that funds are the quintessential investment vehicle of individual investors.
Therefore, we have dedicated a series of articles on this blog to the theme of the selection of mutual funds, ranging from their description and characteristics, the types and investment policies, to profitability, and costs.
We have also published several articles on the choice between active and passive (or indexed) investment funds, including their differences and their advantages and drawbacks.
In the Tools folder we have been presenting some of the largest equity and bond mutual funds, actives and passives, traded in the USA and Europe.
What is the Active vs Passive Barometer?
Morningstar’s Active/Passive Barometer is a useful metric that can help investors better calibrate the chances of success with active (or active management) mutual funds from Europe, Asia and Africa in different areas, based on recent trends and long-term history.
The Active/Passive Barometer is a half-yearly report – published in May and November – that assing the performance of Europe’s active mutual funds in relation to passive (or indexed) mutual funds grouped into their Morningstar Categories.
This barometer is also very comprehensive, comprising more than 30,000 active and passive funds from Europe, Asia and Africa, which represent about 10 billion euros in asset values under management, or about 75% of the fund market in that region.
It uses several unique ways to measure the success of active managers.
It evaluates active mutual funds against a composite of actual passive funds, rather than a theoretical comparison against any index without costs or charges.
Thus, the “reference” reflects the actual, net performance of fees or management fees of passive or indexed mutual funds.
It assesses active funds based on their begining-of.period category classification to better simulate the funds an investor would have chosen at the time.
It assesses how the average euro invested in various types of active mutual funds has outperformed the average euro invested in the composite of passive mutual funds.
It also analyses the success rates of the active mutual fund at the level of the fees charged.
Main conclusions
The main findings of this report are:
Long-term success rates for active managers remain low overall.
Low average success rates of active managers in historical terms
The average success rate of active stock managers in the last decade was 24%, while the average success rate of active bond managers was 21%.
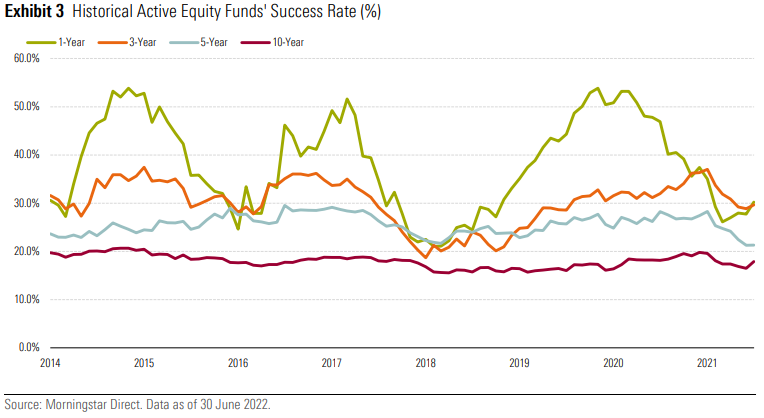
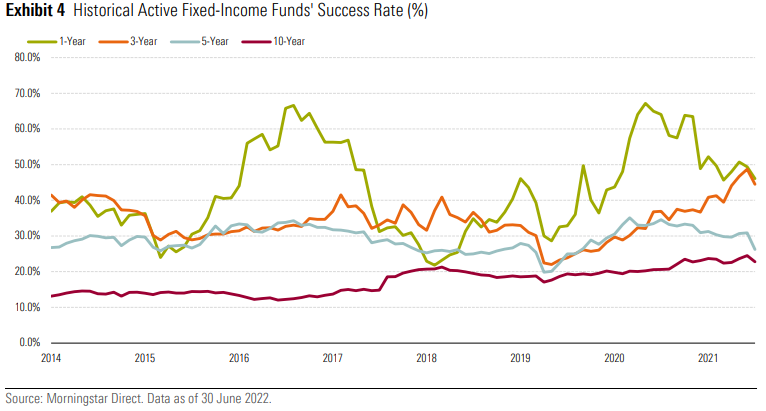
Success rates of active equity fund managers by categories
Over the 10 years to June 2022, the success rate of active managers was less than 25% in more than half of the 72 categories surveyed in large asset classes.
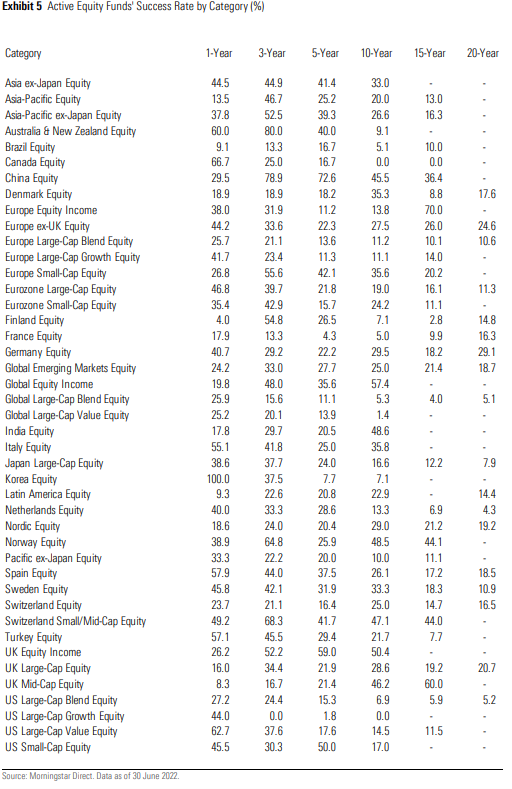
What’s more, only three categories – global income stocks, UK income stocks and Swiss real estate – had a success rate for active managers above 50%.
Survival rates are positively correlated with probabilities of success.
The biggest determinant of the failure of active funds is their inability to survive, which often results from very poor performance.
This can be explained by a mixture of wrong decisions on the choice of securities and the negative effects of higher commissions on their low-cost passive competitors.
The 10-year success rates of active funds in the largest categories of multi-country stocks remained low to moderate in all key exposures.
The share of active managers who survived and outperform in large market segments, such as large global capitalisations and large capitalisations in Europe, was 5.3% and 11.2%, respectively.
Active managers in global emerging markets and ex-UK Europe were better, with success rates of around 25%.
The 10-year success rates for active managers in the main stock categories of each country were more mixed, although overall they continued to favor passive funds.
Success rates in the category of large U.S. capitalizations remained particularly low at 6.9%.
By contrast, almost a third of UK’s large capitalisation managers have hit their passive counterparts, which has risen to almost 50% for active managers of UK medium-capitalisation.
Success rates of active bond fund managers by categories
The 10-year success rates for active bond managers also remain low to moderate in all categories analyzed.
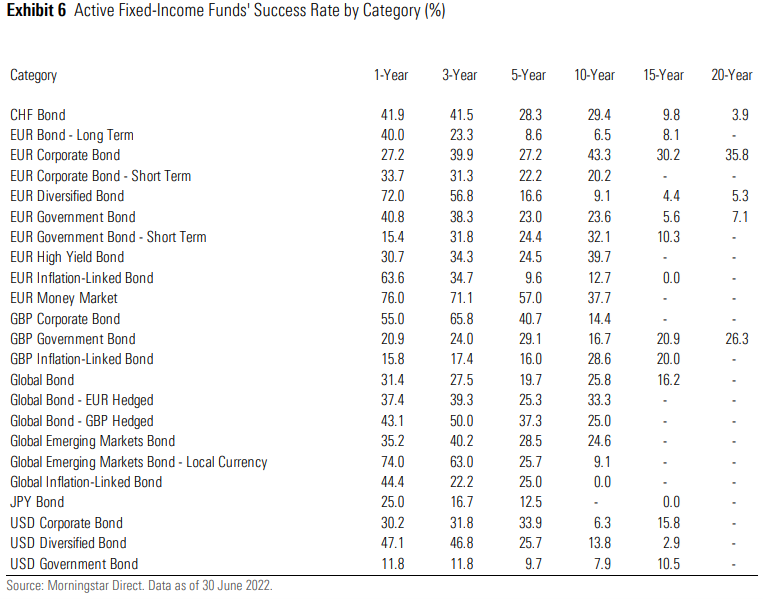
The best results were recorded in the success rate of active funds in the categories of bonds of companies in euro and high yield, which stood at 43.3% and 39.7%, respectively.
By contrast, the 10-year success rate of active funds in the global emerging market bond category was 9.1%, while for U.S. treasury bonds it was 7.9%.
Financial markets in the first half of 2022 faced several adverse conditions.
This was the kind of environment in which active managers could be expected to beat passive pairs more easily, as they typically incorporate the total disadvantage in market valuations.
However, the success rate of active managers in the Europe, Asia and Africa categories in the period of one year to the end of June 2022 failed to impress.
On average, 35% of the funds active in the 43 categories of shares analyzed survived and exceeded their corresponding passive fund in the period of one year to the end of June 2022.
Only seven stock categories had a success rate for active managers above 50% in this period.
The average success rate of fund and bond managers in the 23 categories analysed was slightly higher by 40% in the 12 months to the end of June 2022.
Seven categories showed a one-year success rate above 50%.
Morningstar also publishes a parallel version of the assessment of U.S. investment funds.
Access here:
https://www.morningstar.com/en-uk/lp/european-active-passive-barometer


