In the series “How they invest” we address the characteristics of the main classes of individual and institutional investors, which we consider useful to guide the investments of most individual investors.
Regarding individual investors, we have presented in previous articles the distribution of world wealth, the characteristics and differences of investors from various regions or countries, different levels of wealth, and especially different generations and women.
In this article we focus on the important issue of the distribution and growth of world wealth and especially the differences in the allocation of assets in the various regions.
In other articles we have also seen the importance of investing in the financial markets, in order to obtain attractive returns that are higher than inflation, with a moderate level of risk.
We conclude that we should do so by following a medium and long-term investment process, based on diversification to mitigate risks, and on the choice of asset allocation most adjusted to our financial objectives, financial situation and risk profile, to the extent that this allocation largely determines the expected performance.
We have also seen that investment funds are the most suitable vehicle to realize the desired allocation of assets, since they are very accessible, efficient and provide a good level of diversification.
The selection of these funds depends on their characteristics, and it is important to analyze their investment policy, the expected return and risk, and their costs, and it is important to consider the choice between active and passive management funds.
We have observed that the process of financial investments is a way of put the economy to work for us by investing in the large global companies that produce the goods we consume, as do the big investors like Warren Buffett or Norges Bank, and can help us to improve our standard of living considerably.
Gross wealth asset allocations globally have remained virtually stable over the past 10 years: 28% cash, 42% securities and 30% insurance and pensions.
Cause and/or consequence? Households in richer countries invest more in stocks
The U.S. is the world leader in wealth and stock market investment
The European case: The less wealth, income and savings, the more deposits and fewer investments in financial securities
In Asia, Japan and China stand out for the opposite reasons, lower and higher allocation to financial assets, although in this case it is not traditional investments in stocks or bonds, but products created by banks with indefined risk.
Latin America also reveals great contrasts, with high allocations to financial assets in Brazil and Mexico, and low in the remaining countries.
Gross wealth asset allocations globally have remained virtually stable over the past 10 years: 28% cash, 42% securities and 30% insurance and pensions.
Allianz conducts a study called the Global Wealth Report in which it analyses the situation and evolution of the financial situation of household wealth around the world, by regions and countries, including gross and net worth, as well as its composition.
The most recent was published in 2022.
Overall, the composition of assets by asset classes and their growth between 2011 and 2021 was as follows:
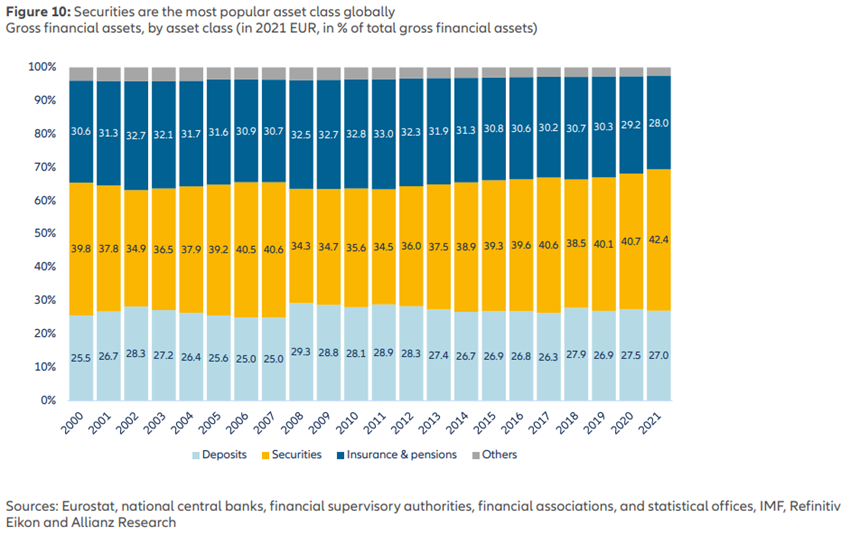
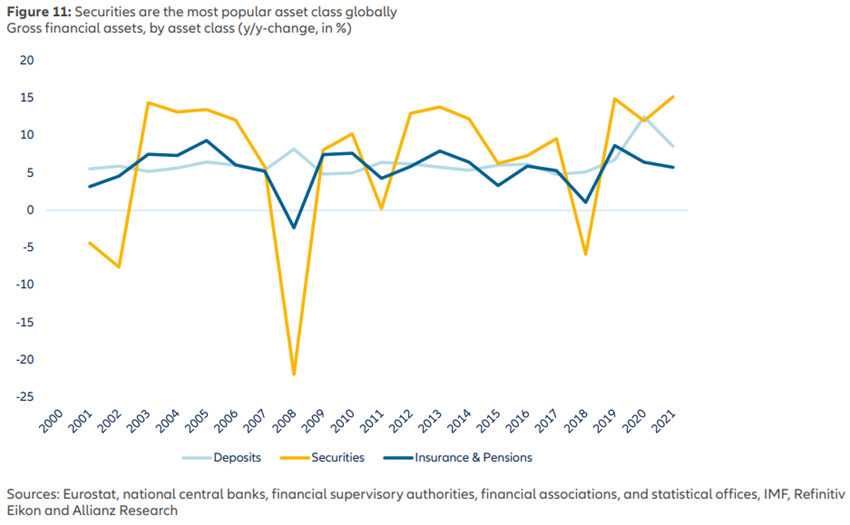
In these 10 years, the weight of the various financial asset classes has remained fairly stable, distributed at 28% in cash, 42% in securities and 28% in insurance and pensions.
Only in the years of the financial crisis there was a change, with the reduction of securities to a minimum of 35% and a uniform increase of the other two classes.
Cause and/or consequence? Households in richer countries invest more in stocks
The following graph shows the composition of gross financial assets by the same classes at the level of the main world regions:
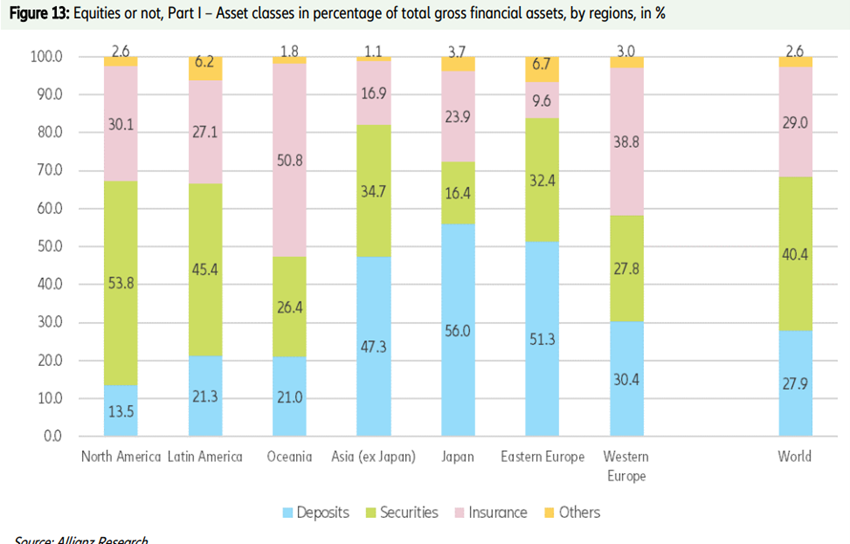
The most developed countries have the lowest percentage in deposits and the highest in investments in financial assets.
Highlight for the 54% in securities in North America, as well as the high percentages of investments in insurance and pensions in Oceania, Western Europe and even the USA.
The U.S. is the world leader in wealth and stock market investment
The U.S. is the country with the highest concentration of the world’s financial wealth:
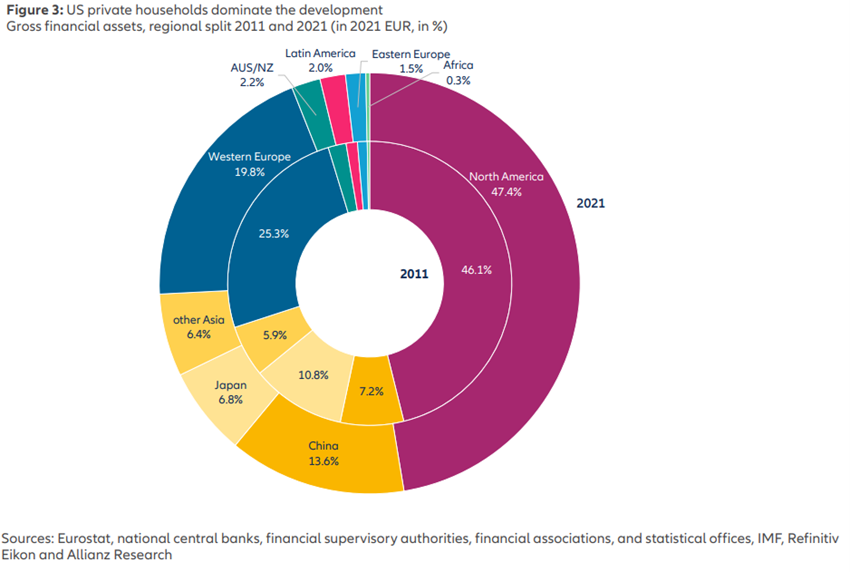
North America concentrates 47% of the world’s financial wealth with €108 trillion (of which €104 trillion in the US), followed by Western Europe with €33 trillion and China with €32 trillion (14% each).
Next comes Japan with €16 trillion (7%), and finally Oceania, Eastern Europe and Latin America, with percentages between 3.8% and 2.6%.
In a previous article we had already seen that North America leads the way in global wealth, followed almost on par by Western Europe and Asia ex-Japan. but at the household level the richest countries are Switzerland, Japan and the Netherlands.
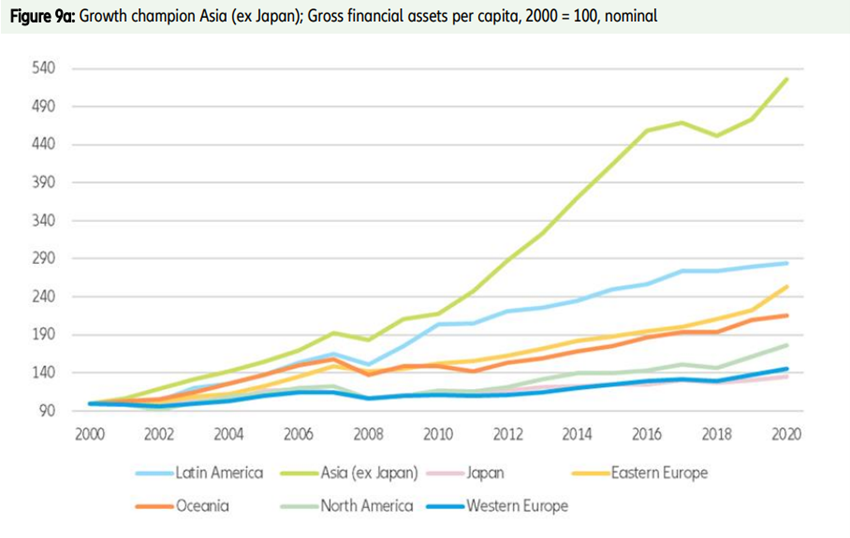
We have seen that the greatest growth of world wealth in the last 10 years has been in emerging economies, especially in Asia ex-Japan, Latin America and Eastern Europe due to their population and increased productivity:
U.S. households have few deposits and many investments in bonds:
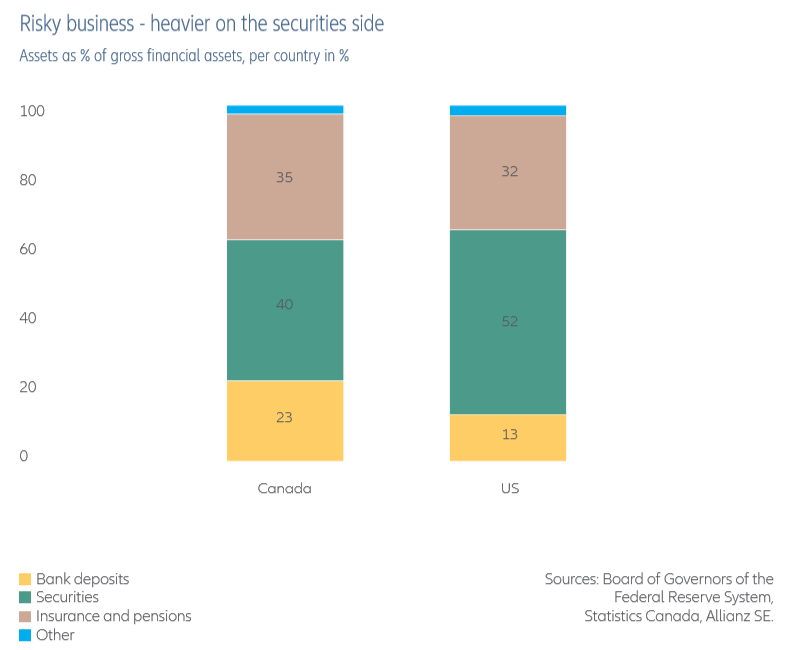
U.S. households invest 52% of their gross financial assets in bonds and only invest 13% of it in deposits.
About 32% are invested in insurance and pensions.
The European case: The less wealth, income and savings, the more deposits and fewer investments in financial securities
In the following graph we see the distribution of gross financial assets in the main European countries:
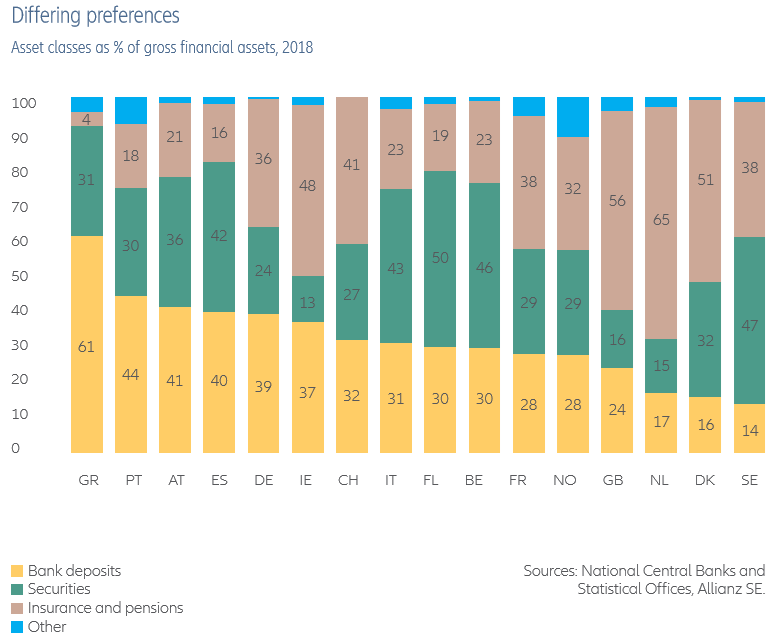
Greece and Portugal have high percentages of deposits, as opposed to the Nordic countries, the Benelux countries and the United Kingdom which are at the other extreme.
The poorer the country, the greater the weight of deposits and the lower the weight \in financial investments. Is this a cause or a consequence? We believe it is the result of both.
In Asia, Japan and China stand out for the opposite reasons, lower and higher allocation to financial assets, although in this case it is not traditional investments in stocks or bonds, but products created by banks with indefinite risk.
In the various Asian countries the situation is very divergent:
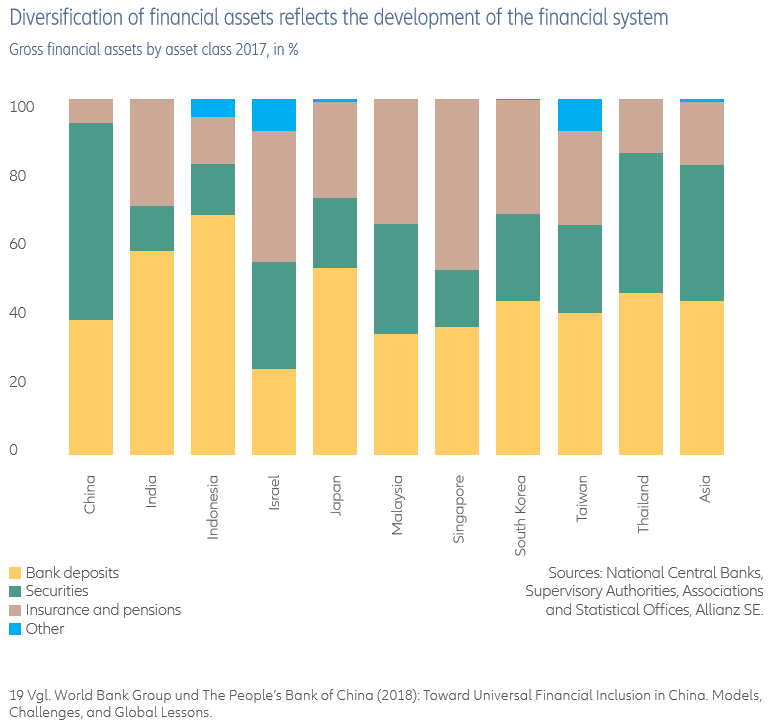
At first glance it is surprising the high percentage of deposits in Japan and the high allocation to financial assets of China. The explanation is simple.
The last world war destroyed much of the country’s financial wealth as did the other belligerents and especially the losers, and the recovery begun in the seventies was reversed by the debacle of the Japanese miracle in 1990.
For China, investment in financial assets is misleading because they are actually bank-backed rate products and in many cases Wealth Management Products, which are in the crosshairs of regulators for the risk incurred.
Latin America also reveals great contrasts, with high allocations to financial assets in Brazil and Mexico, and low in the remaining countries.
In Latin America, the situation is also one of great contrasts:
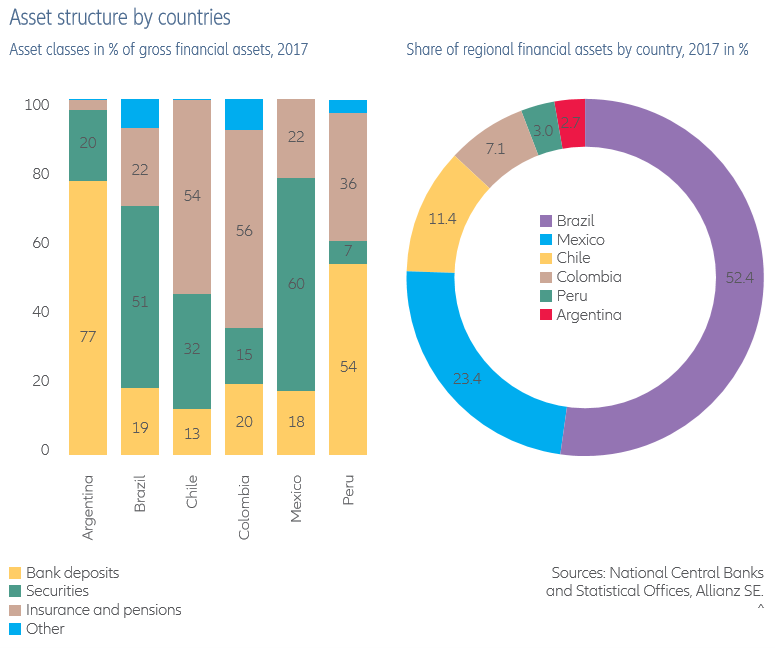
In Brazil and Mexico the allocation to financial assets is very high and this is due to the degree of development of the respective capital markets. In other countries, households invest mainly in deposits or insurance products.
In another previous article we also saw that these differences in asset allocation by regions blur when we look at the same allocation in terms of households with similar incomes.
We conclude that allocation is determined by income and wealth, which overlap with social or cultural factors.


